
FIG. 1.
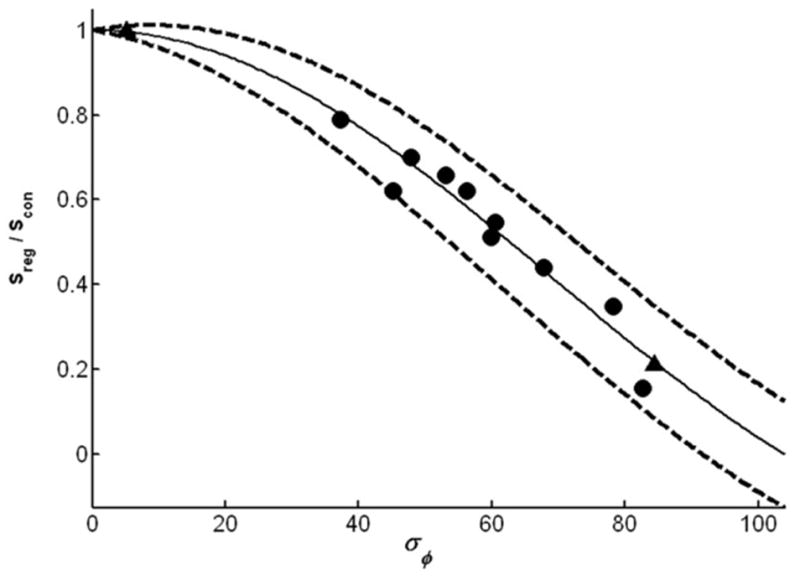
Predicted SNR reduction of conventionally averaged signals as a function of the SD of the phase of individual acquisitions, σφ (solid line), as given by Eq. [2]. This curve is the same as the ratio of conventional to constructive averaged signals, Sreg/Scon. Dashed curves enclose the 95% confidence intervals (based on Eq. [3]). The reciprocal of the curve is the expected SNR gain from constructive averaging. Experimental data points derive from constructively averaged 1H MRS spectra from the human heart (circles) and from a leg without (left triangle) and with (right triangle) tremor, all at 1.5 T.