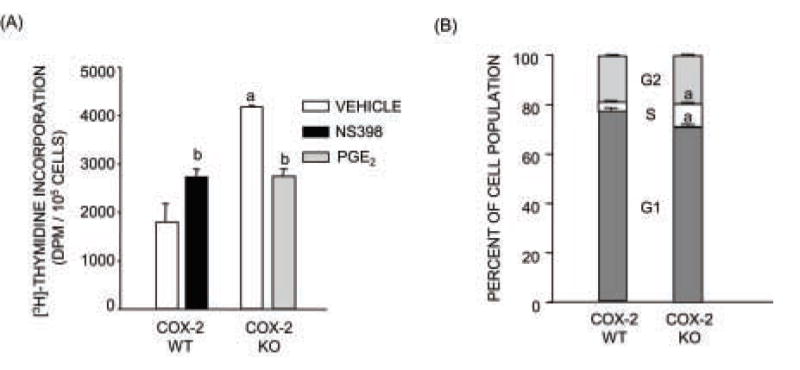
Figure 3. Cell proliferation and cell cycle progression in calvarial osteoblast cultures from COX-2 WT and KO mice.

(A) 3H-thymidine incorporation (TdR). Cultures were treated with vehicle, PGE2 (1 μM) or NS398 (0.1 μM) throughout culture. TdR was measured on day 4 of culture after a 2-h pulse of 3H-thymidine. TdR was normalized to cell number in parallel cell cultures. Bars are means ± SEM for n=3. aSignificant effect of genotype, P<0.01. bSignificant effect of treatment, P<0.05. (B) Cell cycle analysis by flow cytometry after APC-BrdU/7-AAD staining. Results were calculated from three independent experiments. Cells were cultured for 4–5 days with BrdU incubation 2–4 hours after medium change. Bars are means ± SEM for n=3 experiments. aSignificant effect of genotype, P<0.01.
