
Fig. 3.
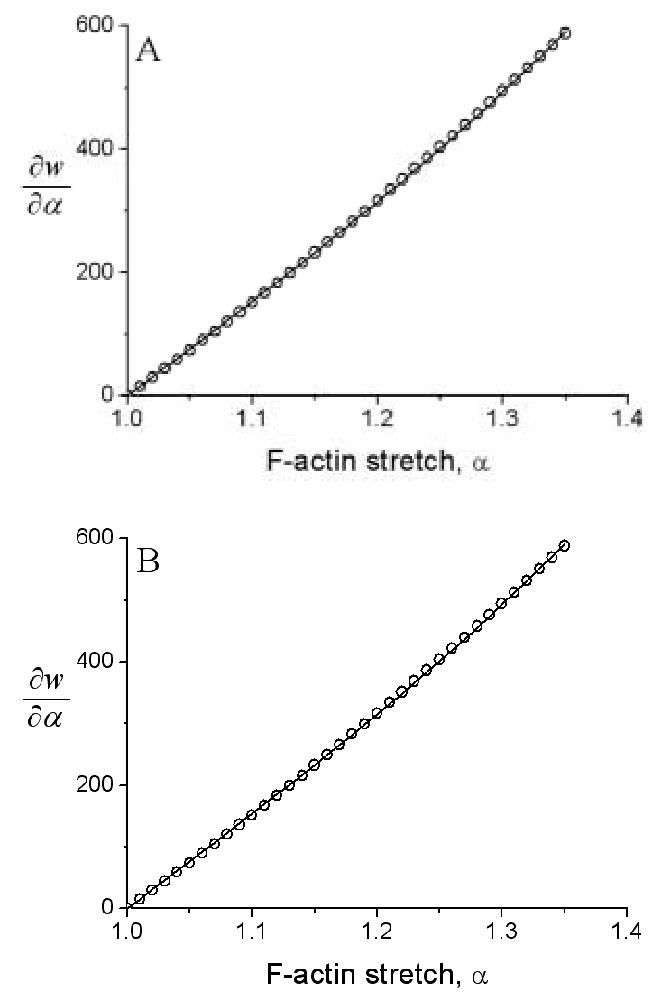
Shown as data (open circles) are results from a polynomial fit ∂w/∂α=656α2+138α-794 kPa to the Deguchi et al. (2006) data on stress fibers. Shown, too, are best-fits (solid lines) for (A) the exponential model of F-actin elasticity (Eqs. 6 and 7) and (B) the molecular model of F-actin elasticity (Eqs. 6 and 8). Note the comparable fits to data despite one model being phenomenological (panel A) and one being molecular (panel B). Note, too, the slight nonlinearity over this range of finite stretch, which could not be captured with a linearly elastic model.