
Fig. 6.
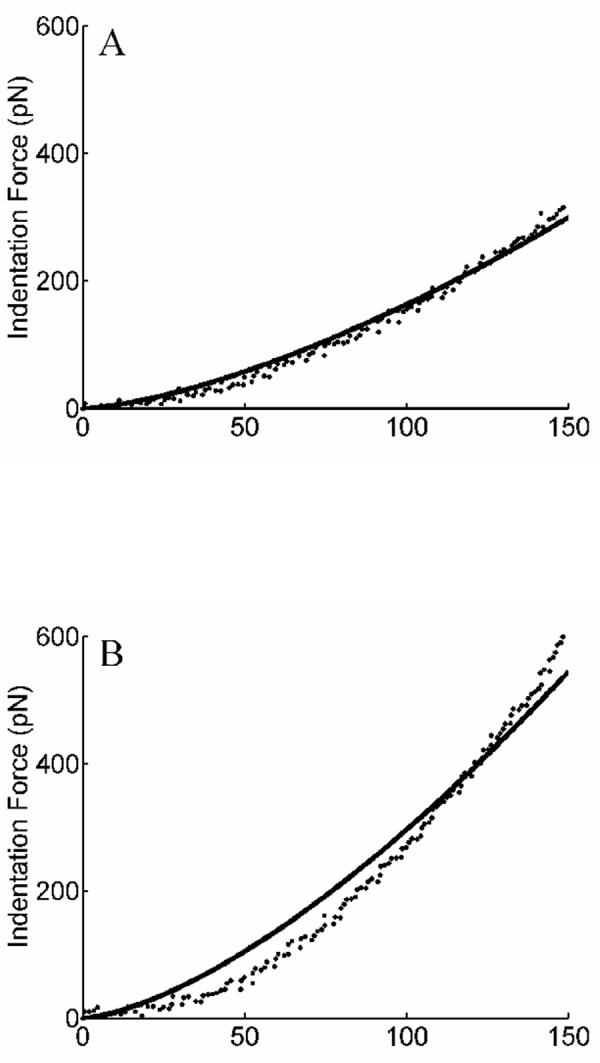
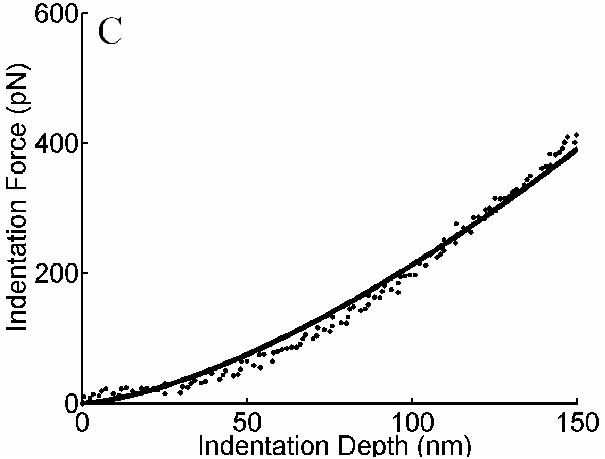
Representative indentation force-depth curves from AFM measurements obtained from independent experiments as well as best-fits obtained with the remodeling model: (A) unstretched cells; (B) cells subjected to 2 minutes of 10% cyclic stretch; (C) cells subjected to 30 minutes of 10% cyclic stretch. Note the increased stiffness after 2 minutes of stretching but the decrease after 30 minutes of stretching toward the original stiffness.