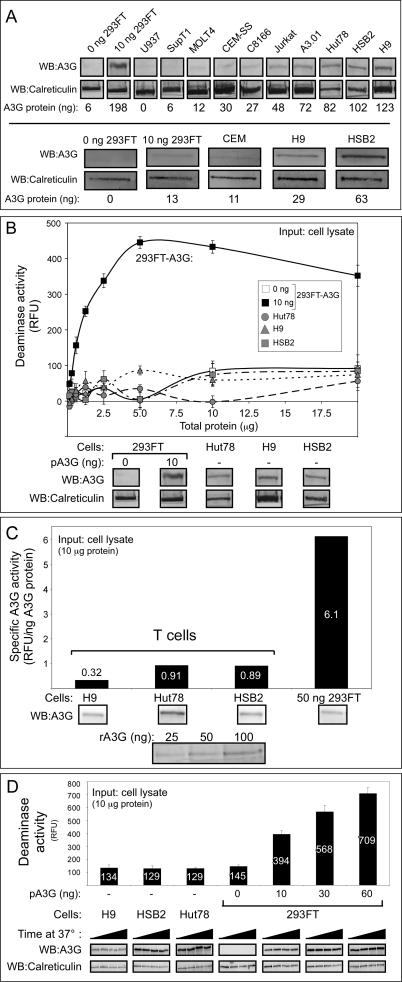
Figure 3. Other T Cell Lines with High Levels of Endogenous A3G Protein Exhibit Very Low Specific Deaminase Activity.
(A) Endogenous A3G protein levels from the indicated T cell lines, compared to 293FT cells mock-transfected (0 ng 293FT) or transfected with 10 ng A3G plasmid DNA, were determined by western blotting (WB) in two independent experiments (top versus bottom panels). Western blots of calreticulin are shown as a loading control. Amount of A3G protein (ng) is indicated in each lane, as determined by densitometry relative to recombinant A3G protein standards that are not shown.
(B) Deaminase activity of different amounts RNase A–treated crude cell lysates either from A3G-expressing T cells or from 293FT cells transfected with 0 or 10 ng of A3G plasmid DNA (pA3G) was determined using the FRET-based assay and was graphed. Amounts of input cell lysate are indicated by μg of total cellular protein. Error bars represent standard error of the mean of triplicate reactions. Below, western blots show relative amounts of A3G compared to the loading control calreticulin for each cell type.
(C) Specific deaminase activity of A3G (RFU/ng A3G protein) was calculated for DNase-treated lysates of H9, HSB2, and Hut78 cells, as well as for 293FT cells transfected with 50 ng A3G plasmid DNA (50 ng 293FT) from a representative experiment and were graphed. Below, western blots show the amount of A3G in each cell lysate and in known recombinant standards (rA3G), which were used to determine protein amounts for specific deaminase activity calculations, as described in Figure S3. Numbers on/above bars indicate actual values graphed.
(D) Western blots show the amount of A3G and calreticulin in equivalent amounts of crude cell lysates from H9, HSB2, and Hut78 T cells or from 293FT cells transfected with the indicated amounts of A3G plasmid DNA (pA3G) and incubated for 0, 30, 60, and 90 min at 37 °C (increased time from left to right). Corresponding A3G activity was determined for all time points using the FRET-based assay, and the maximal activity (90 min) is graphed above. Background fluorescence for each sample using the 13-mer GGG-containing oligonucleotide was subtracted from signal detected with the 13-mer CCC-containing substrate for all FRET deaminase assays. Numbers on/above bars indicate actual values graphed.
All panels are representative of three independent experiments. All FRET assays were performed with RNase A.

