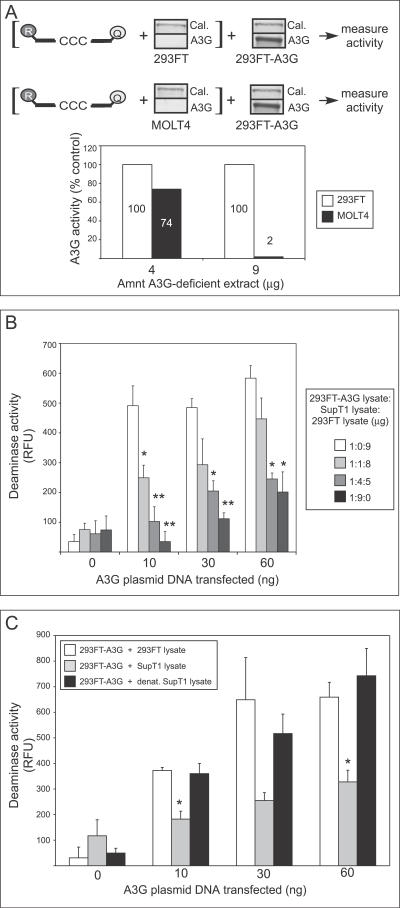
Figure 6. T Cell Lysates Inhibit Deaminase Activity of Exogenously Expressed A3G in 293FT Cell Lysates.
(A) Diagram explains experimental design. Lysate containing 4 or 9 μg of total cellular protein from non-transfected 293FT or MOLT4 cells was pre-incubated for 15 min with the dCdC- containing oligonucleotide (labeled with reporter [R] and quencher [Q] fluorophores), followed by the addition of lysate containing 1.0 μg of cellular protein from 293FT cells transfected with 1.0 μg of A3G plasmid DNA. Western blots show the amount of A3G protein in each lysate along with calreticulin (Cal.) as a loading control. A3G deaminase activity was then determined using the FRET-based assay. Activity measurements are graphed as percent of the activity of the 293FT control (to which non-transfected 293FT lysate was added). Numbers on/above bars indicate actual values graphed.
(B) Lysate containing 1.0 μg of total cellular protein from 293FT cells transfected with the indicated amounts of A3G plasmid DNA was combined with the indicated amounts of lysate from A3G-deficient Sup T1 cells (representing 0, 1, 4, or 9 μg cellular protein). Total cellular protein in each sample was adjusted to 10 μg by adding lysate of non-transfected, A3G-deficient 293FT cells. Total cellular protein amounts (μg) for each of the three cell lysates separated by colons are indicated in box. A3G deaminase activity was then determined using the FRET assay and is graphed. Statistical significance relative to the A3G-deficient 293FT control (i.e., the 1:0:9 point), * p < 0.01, ** p < 0.001. Error bars represent standard error of the mean of triplicate reactions.
(C) Lysate containing 1.0 μg of total cellular protein from 293FT cells transfected with the indicated amounts of A3G plasmid was combined with lysate containing 9 μg of total cellular protein derived from either non-transfected 293FT cells (open bars), SupT1 cells (grey bars), or SupT1 cells that were lysed and heated at 60 °C for 30 min (black bars). A3G deaminase activity was then determined using the FRET-based assay and is graphed. Statistical significance relative to 293FT control, * p < 0.01. Error bars represent standard error of the mean of triplicate reactions.
All FRET assays were performed with RNase A. Background fluorescence obtained using the 13-mer GGG-containing oligonucleotide was subtracted from signal detected using the 13-mer CCC-containing substrate.

