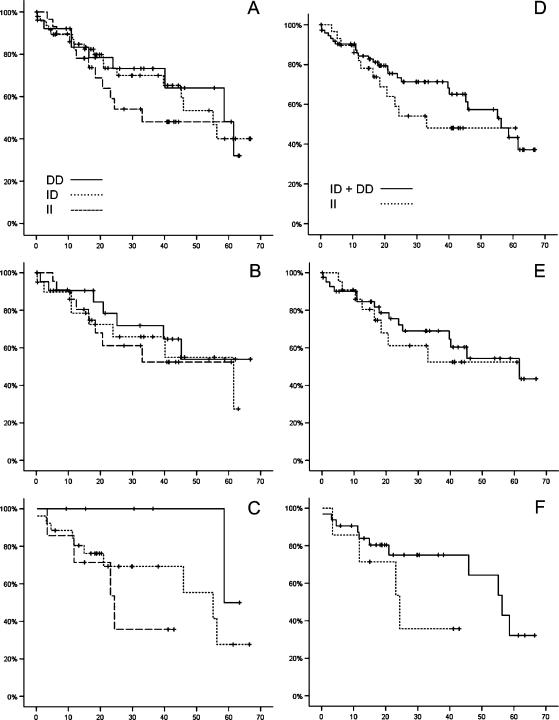
Figure 4.
Kaplan-Meier survival curves for the ACE I/D gene polymorphism in CRC patients. Patient survival is shown for the whole study population in (A) and (D), for men in (B) and (E), and for women in (C) and (F) across all genotypes (A–C), or for the dichotomization of the patient population into carriers homozygous for the II-allele and carriers heterozygous (ID) or homozygous for the D-allele (D–F). Gender difference was noted. Women with the DD genotype lived longer than women with the ID or II genotype. The x-axis denotes survival time (months), and the y-axis denotes survival probability.

