
FIGURE 7.
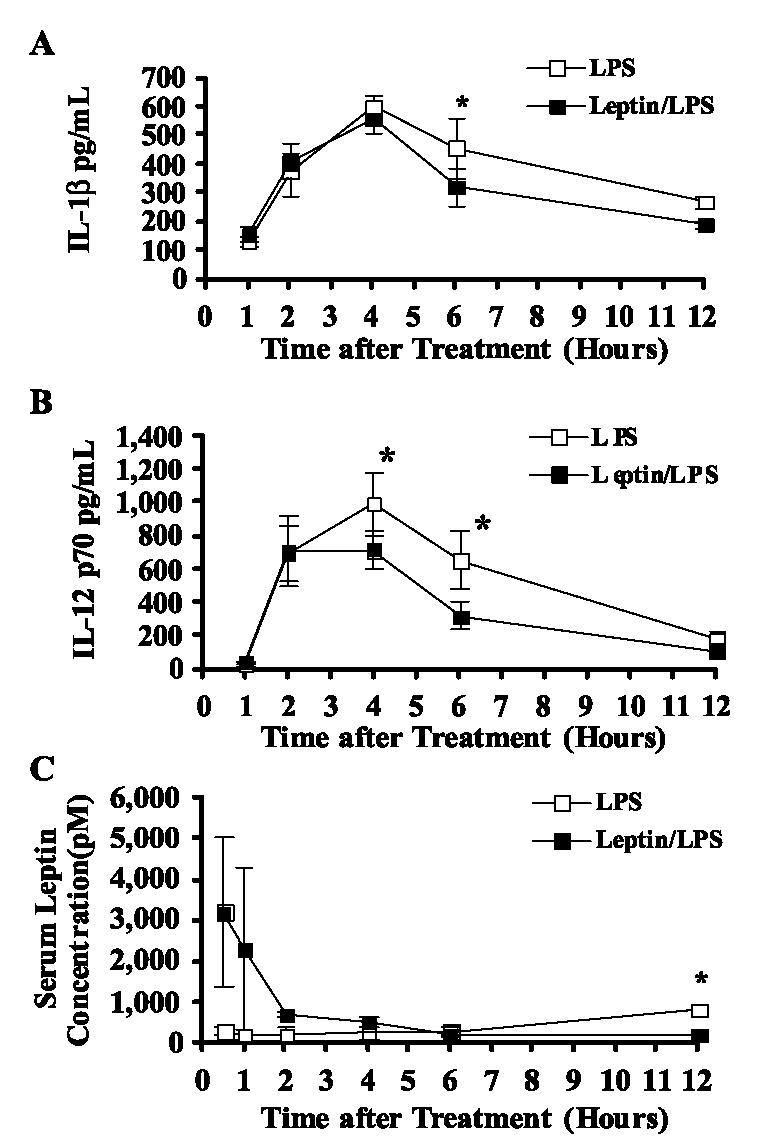
Effect of leptin on serum IL-1β (A), IL-12 p70 (B), and leptin (C) levels induced by E. coli LPS administration. Female BALB/c mice were simultaneously administered (i.p.) either saline or leptin (1 μg/g body weight) and challenged with either saline or E. coli LPS (100 μg/ mouse). Serum was obtained from 10 animals per group 1–12 h after above treatment. Serum cytokine (picograms per milliliter) and hormone (picomole) levels were determined by Luminex bead-based array and the data are reported as mean ± SD. *, p ≤ 0.05 compared with LPS-treated controls.