
Figure 3.
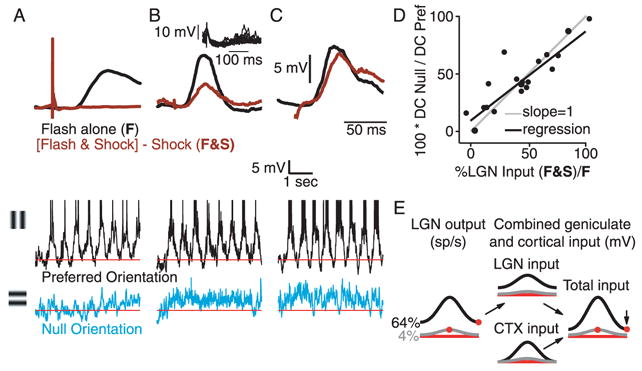
The relationship between the response to null-oriented stimuli and the amount of input from the LGN. A–C. Top, responses to optimal flashed gratings with (brown) and without (black) paired electrical stimulation of nearby cortex for 3 cells. The response to electrical stimulation alone has been subtracted from the brown traces. The ratio of the amplitudes of the brown and black traces (F&S/F) is taken to be the proportion of synaptic input the cell receives directly from the LGN. The cell in A receives almost no direct input from the LGN; the cell in C receives almost exclusive input from the LGN. Middle and bottom, responses to high-contrast drifting gratings of the preferred and null orientation for the 3 cells. Inset in B shows 20 superimposed responses to electrical stimulation alone. D. The ratio of responses to null and preferred stimuli (DC component) plotted against the proportion of input provided by the LGN (N=19). E. Left, orientation tuning curves for the combined output from the relay cells exciting the model simple cell that receives input only from the LGN. Right, orientation tuning curves for a cell that receives half it’s input from the LGN and half from other cortical cells with similar preferred orientation. The main effect is to reduce the response of the cell to stimuli of the null orientation.