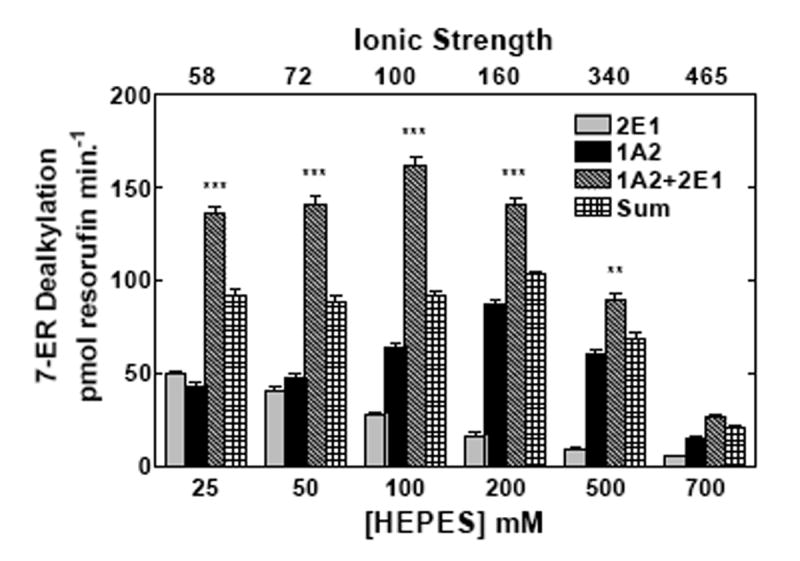
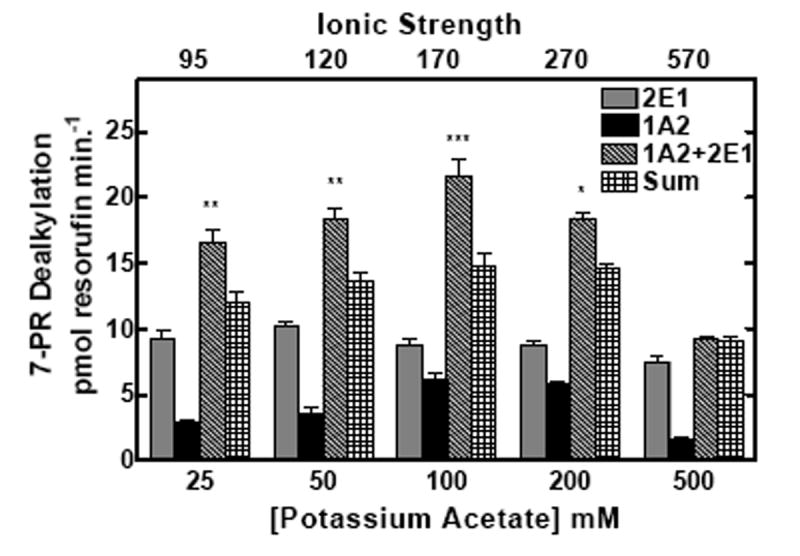
Figure 2. Effect of ionic strength on the interactions among reductase, CYP2E1, and CYP1A2.


CYP2E1, CYP1A2 and reductase were reconstituted in binary (reductase and one P450) and ternary (reductase and both P450s) reconstituted systems. The first and second bars in each group represent binary CYP2E1 and CYP1A2 reconstituted activities, respectively. The third bar represents the results from the mixed reconstituted system, and the fourth bar represents the sum of the rates of the binary systems. EROD and PROD activity were measured under subsaturating conditions (0.5:1.0 reductase:P450). Each reconstituted system contained 0.05 μM P450 (CYP1A2 or CYP2E1 alone), 0.025 μM reductase (CPR), and 8.0 μM DLPC. The mixed reconstituted system contained 0.05 μM of both CYP1A2 and CYP2E1, and 0.05 μM CPR. Calculated ionic strength values for each buffer system are indicated as the top x-axis. Groups represent the mean ± SEM for three determinations. Significant differences in activities between the sum of the two binary systems compared to the mixed reconstituted system are indicated (* p < 0.05; ** p < 0.01; *** p < 0.001). (a) Effect of varying HEPES on EROD activity in simple and mixed reconstituted systems. (b) Effect of varying potassium acetate on PROD activity in simple and mixed reconstituted systems. Each buffer contained 50 mM HEPES and the potassium acetate concentration indicated.
