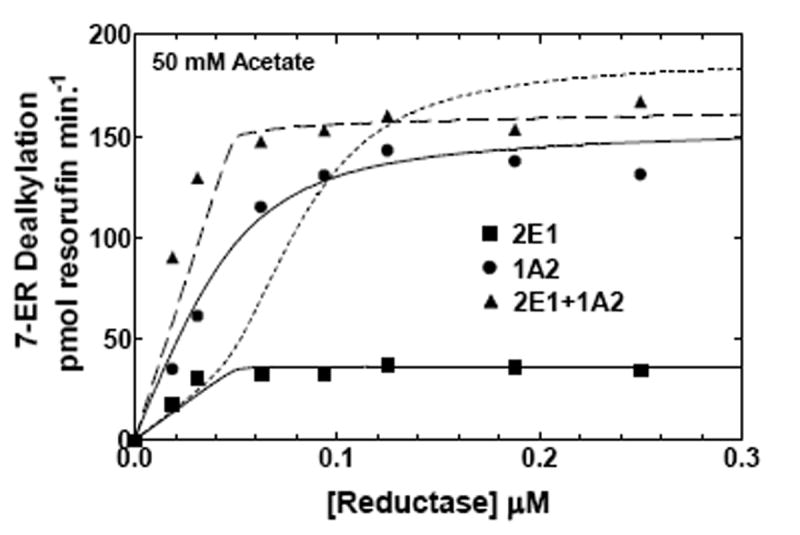
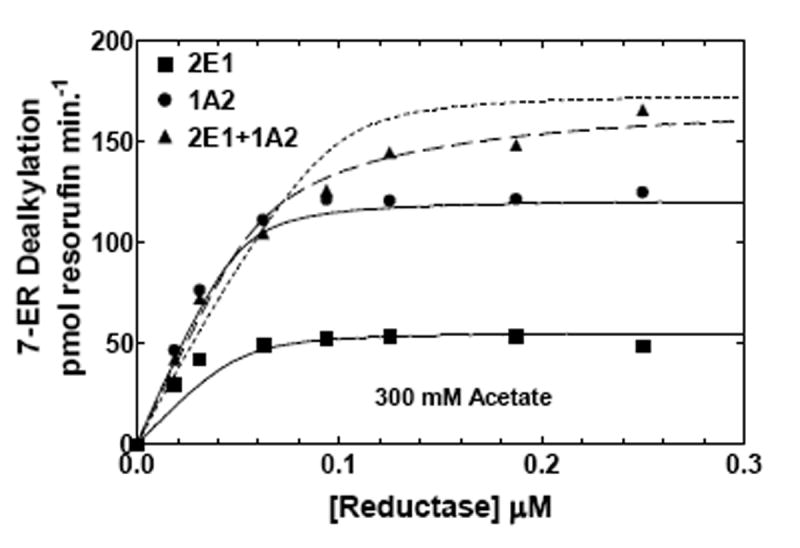
Figure 6. Effects of ionic strength on CYP2E1- and CYP1A2-mediated EROD as a function of reductase concentration.


EROD was measured in both simple and mixed reconstituted systems containing CYP2E1 and CYP1A2 using analogous procedures as described in Fig 5 and in Methods. The data sets are: (●) reductase and CYP1A2, (■) reductase and CYP2E1, and (▲) reductase, CYP1A2 and CYP2E1. The curves for the binary systems were fit to the experimental data using a simple Michaelis Menten interaction between reductase and P450 (solid lines). The curves for the mixed systems are fits of the experimental data representing (1) a mathematical model only allowing the formation of reductase-CYP2E1 and reductase-CYPA2 complexes (dotted line), and (2) a model that permits the formation of CYP2E1-CYP1A2 complexes (dashed line). (A) Effect of binary and mixed reconstitution of CYP2E1 and CYP1A2 on the reductase dependence of EROD at 50 mM HEPES containing 50 mM potassium acetate. (B) Effect of binary and ternary reconstitution of CYP2E1 and CYP1A2 on the reductase dependence of EROD at higher ionic strength (50 mM HEPES containing 300 mM potassium acetate). At higher ionic strength, the experimental data takes on characteristics much more similar to the simple model allowing the formation of only reductase-CYP1A2 and reductase-CYP2E1 complexes (- - - - -). Although the data can still be better fit to the more complex model allowing the formation of heteromeric P450 complexes (— — —), invoking the more complex model only produces a modest improvement in the reliability of the fit.
