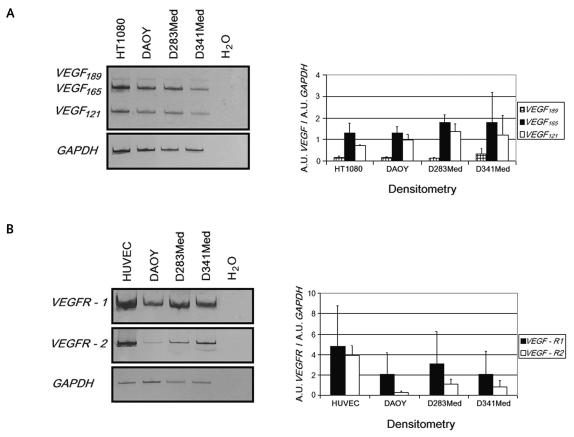
Fig. 1.
Expression analysis. Reverse transcriptase PCR analysis was performed on total RNA as described in Materials and Methods. Expression of GAPDH was used as an internal control to normalize the target gene levels through densitometry. H2O was a negative control to exclude potential contamination. Human fibrosarcoma cell line HT1080 and human umbilical endothelial vein cell (HUVEC) lines were used as positive controls. (A) Left, amplification products from VEGF189, VEGF165, and VEGF121 cDNAs (479, 407, and 275 base pairs, respectively). Right, measurement of relative gene expression levels after densitometric analysis and GAPDH normalization. (B) VEGFR-1 and VEGFR-2 cDNA expression (left) and relative quantification (right). Values are expressed in arbitrary units (A.U.) as means ± SD from three independent experiments.

