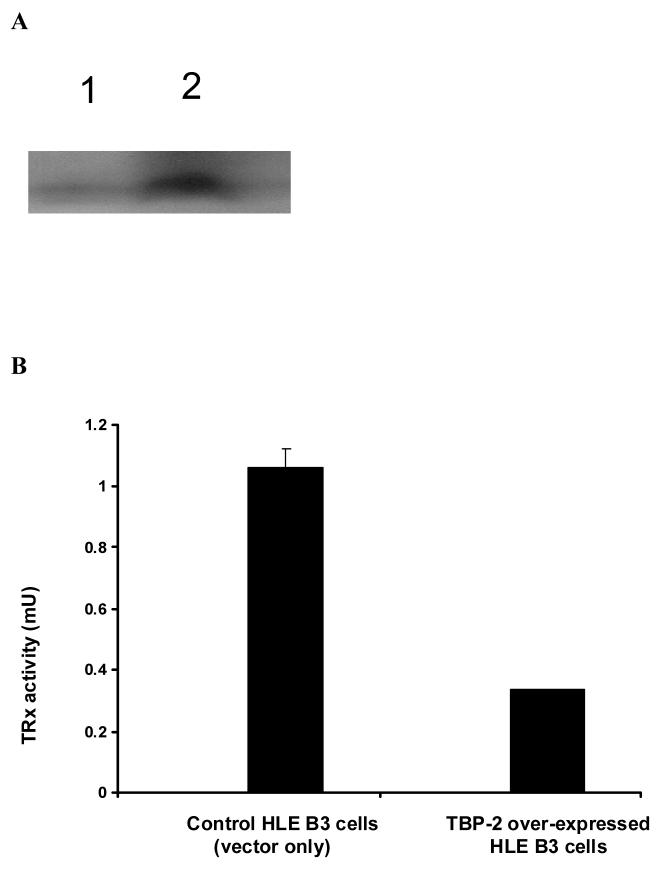
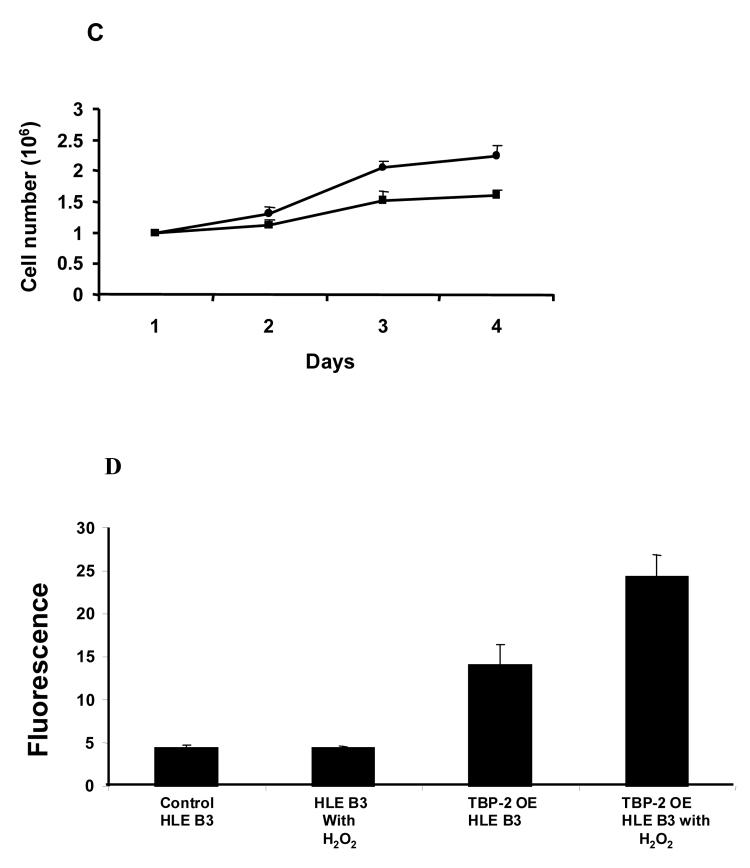
Figure 4. The effect of TBP-2 over-expression on HLE B3 cells.
A, Western blot analysis of TBP-2 expression in control HLE B3 lysate (lane 1) and TBP-2 over-expressed HLE B3 lysate (lane 2). B, Comparison of the TRx activity in control and TBP-2 over-expressed HLE B3 cells. Cells from both groups (2 × 10⁶ cells from each group) were lysed and TRx activity determined as described. C, Comparison of growth rates of control (●) and TBP-2 over-expressed (■) cells during the 4-day growth period by cell counting. The results are based on the average of 3 determinations. Error bars indicate standard errors of the mean. D, Effect of TBP-2 over-expression on H2O2 mediated apoptosis. Control vector only cells and TBP-2 over-expressed cells (OE) were treated either with serum free MEM or with 100 μM H2O2 for 1 hr. Then the cells were washed with PBS and medium was replaced with 20% serum containing medium and incubated at 37°C for 16 hrs. Cells were trypsinized, washed with PBS, stained with Annexin V-FITC and analyzed by flow cytometry (for details see Materials and Methods). The results are based on the average of 3 determinations. Error bars indicate standard errors of the mean.


