Figure 7ag.
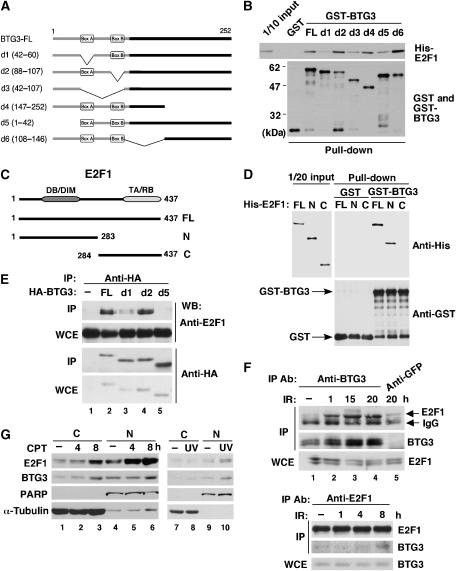
BTG3 interacts with and inhibits E2F1. (A) Schematic representations of BTG3 FL and truncation mutants d1, d2, d3, d4, d5 and d6 with the deleted amino acids indicated in parentheses. (B) BTG3 interacts directly with E2F1 in vitro through the N-terminal 60 amino acids including box A but not box B. GST pull-down assay was performed with GST or GST-BTG3 proteins and purified His-E2F1. The amounts of input and pulled down proteins are shown by Western blotting. (C) Schematic diagrams of E2F1 FL and two truncation mutants N and C. The truncation mutant E2F1-N contains the DNA-binding domain (DB) and a region responsible for DP1 interaction (DIM), whereas E2F1-C carries the transactivation (TA) and RB-binding (RB) domains. (D) The N-terminal domain of E2F1 interacts directly with BTG3 in vitro. GST pull-down assays were conducted as in panel B. Shown are Western blots of input and pulled down proteins. (E) BTG3 and E2F1 interact in vivo. HA-tagged BTG3 and E2F1 were coexpressed in HCT116 cells and the interaction was detected by immunoprecipitation with anti-HA followed by immunoblotting with E2F1 antibody. (F) DNA damage enhances the interaction between endogenous E2F1 and BTG3. HCT116 cells were irradiated with 8 Gy of IR and collected at the indicated times. The interaction was analyzed by immunoprecipitation with anti-BTG3 (upper panel) or by anti-E2F1 (lower panel). An unrelated antibody anti-GFP was used as a negative control. (G) Cellular distribution of BTG3 and E2F1 before and after DNA damage. HCT116 cells were treated with 20 nM CPT and collected at the indicated times, or with UV (30 J/m2) and harvested 2 h later. Cytosolic (C) and Nuclear (N) fractions were then separated and analyzed by Western blotting. PARP and α-tubulin were used as nuclear and cytosolic markers, respectively. (H) The transactivation activity of E2F1 is inhibited by FL BTG3, but not by BTG3 mutants that bind poorly to E2F1. HCT116 cells were transfected with E2F1 and a luciferase reporter driven by the ARF promoter, together with or without cotransfected HA-BTG3. Values are shown after normalization to the coexpressed β-galactosidase activity. Averages of three duplicated experiments are shown; error bars represent standard deviations. The levels of FL and truncated BTG3 used in these experiments are shown on the right by Western blotting. (I) BTG3 inhibits the activation of the Cdc6 and the E2x4 reporter by E2F1. (J) Activation of the ARF promoter by E2F2 and E2F3 is inhibited by BTG3. (K) Depletion of endogenous BTG3 by siRNA enhances E2F1-mediated transactivation. HCT116 cells were first transfected with control or BTG3 siRNA and then transfected the next day with the ARF reporter in the presence or absence of cotransfected E2F1. Assays were conducted as in panel H. A 50% increase was observed in E2F1-mediated transactivation when BTG3 expression was ablated. (L) The expression of endogenous ARF was increased in BTG3 knockdown IMR90 cells. RT–PCR was performed on RNA extracted from siRNA-transfected IMR90 cells, using specific primers corresponding to the coding region of p14/ARF. Numbers indicate relative expression after normalization to actin.

