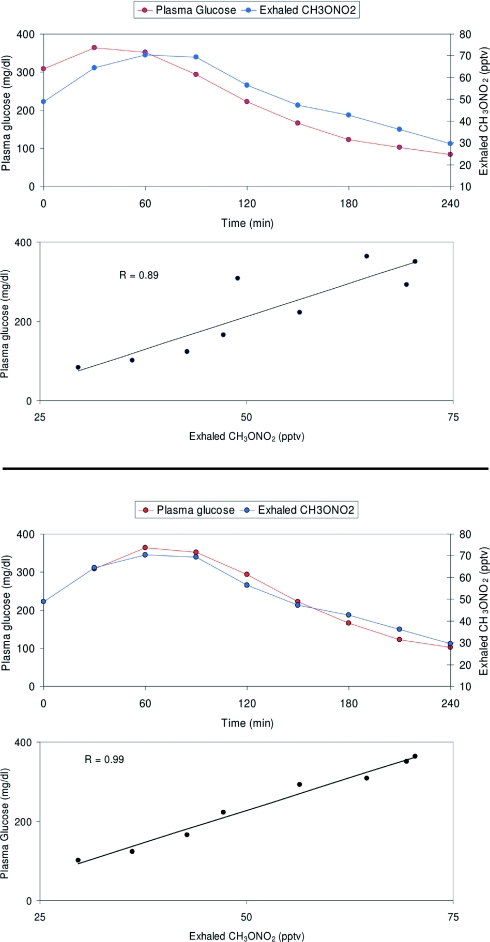
Fig. 2.
Plasma glucose and exhaled methyl nitrate profiles in one child (Fig. 1, H2) with T1DM who started the experiment in hyperglycemic conditions, with gradual correction of hyperglycemia via i.v. insulin infusion. The two upper graphs show data as they were initially recorded, already displaying a strong correlation between the two variables; when corrected for a 30-min time lag (the lower two graphs), the two curves appear to overlap almost exactly, with further strengthening of their correlation, suggesting that at least in some subjects a certain delay may exist between changes in plasma glucose and corresponding changes in exhaled VOCs.

