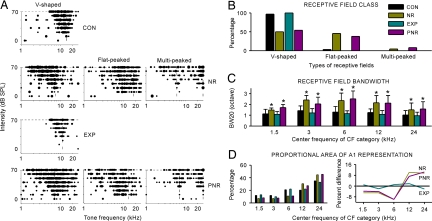
Fig. 2.
Differences in neuronal response selectivity. (A) Representative examples of tonal receptive fields obtained from CON, NR, EXP, and PNR rats. Responses are represented by dots in the response area, with dot size proportional to the number of spikes evoked by tonal stimuli at each frequency and intensity. Dotted lines indicate positions of peaks of the receptive fields (marking CFs). (B) Distribution of receptive field types for all recordings obtained from four different rat groups. (C) Average receptive field BW20 for all recording sites in different groups of rats for each of five CF ranges. Values shown are mean ± SD. Bin size = 1 octave. *, P < 0.001. (D) Distribution of CF values for all recordings obtained from different groups of rats (Left) and difference functions calculated by subtracting the CF distribution in CON rats from that of NR, EXP, or PNR rats (Right). Zero values (solid black line) indicate no difference relative to the CF distribution of CON rats.

