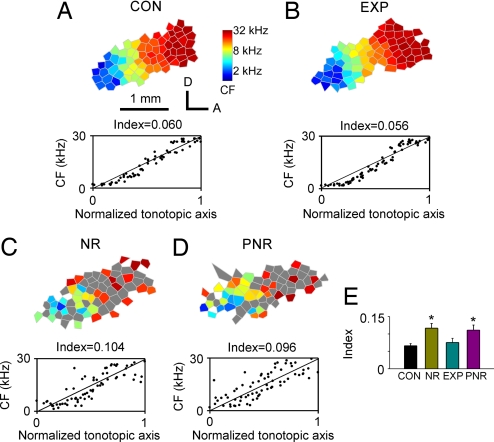
Fig. 4.
Topographic organization of A1. (A–D) (Upper) Representative maps illustrating the tonotopic organization within A1 recorded in CON, NR, EXP, and PNR rats. The color of each polygon indicates the CF (kHz) for neurons recorded at that site (see the scale to the right of A Upper). Polygons are Voronoi tessellations generated so that every point on the cortical surface was assumed to have the characteristics of its closest neighbors. Gray polygon in NR and PNR rats represents the flat- or multipeaked tuning curve recorded at that site. A, anterior; D, dorsal. (A–D) (Lower) Distribution of the cortical representation of different CFs along the tonotopic axis of the A1 for each example CF map. Normalized coordinates from each rat are plotted as a function of the defined CFs. Index (see Materials and Methods) of tonotopic orderliness is shown above each box. (E) Average tonotopic indices for CON, NR, EXP, and PNR rats. Values shown are mean ± SD. *, P < 0.001.

