
Figure 1.
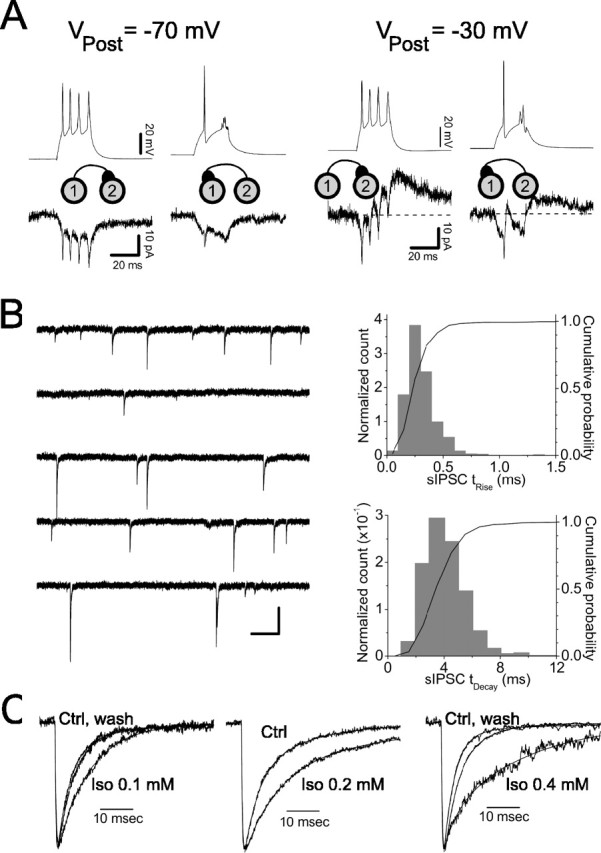
Synaptic coupling parameters in LI interneurons. A, Bidirectional electrical and chemical coupling between a pair of LI interneurons. The top traces show membrane potential recorded in the presynaptic cell under current clamp, and the bottom traces show membrane current recorded in the postsynaptic cell recorded under voltage clamp. The identities of the presynaptic and postsynaptic cells are indicated by the diagrams between the voltage and current traces. Left, Responses when the postsynaptic cell was held near the reversal potential for Cl-(VPost = -70 mV); right, responses recorded with the postsynaptic cell held at -30 mV. The resting potential of the cell 1 was -71.4 mV, and the resting potential of the cell 2 was -69.0 mV. The traces are the averages of 10-15 trials each. Before averaging, the traces were aligned on the time axis to the peaks of the first action potential in the presynaptic cell. This distorted the responses to the subsequent action potentials in the averages, which is particularly evident in the traces in which cell 2 was the presynaptic cell. B, sIPSCs recorded from an LI interneuron under whole-cell voltage clamp. Left, Ten seconds of continuous data recorded at a holding potential of -60 mV. IPSCs are inward because the cell is Cl- loaded. Right, The distribution of 10-90% rise times (top) and 63% decay times (bottom) for the same cell based on 10 min of recorded data. C, Modulation of sIPSCs by isoflurane (Iso). The averaged, normalized sIPSCs from three different cells treated with 0.1 mm isoflurane (left), 0.2 mm isoflurane (middle), and 0.4 mm isoflurane (right) are shown. Weighted decay time constants were as follows: left: Ctrl, 7.3 ms; Iso, 9.9 ms; wash, 8.2; middle: Ctrl, 9.5 ms; Iso, 21.4 ms; wash, not recorded; right: Ctrl, 5.0 ms; Iso, 19.3 ms; wash, 5.9 ms. Ctrl, Control.