
Figure 5.
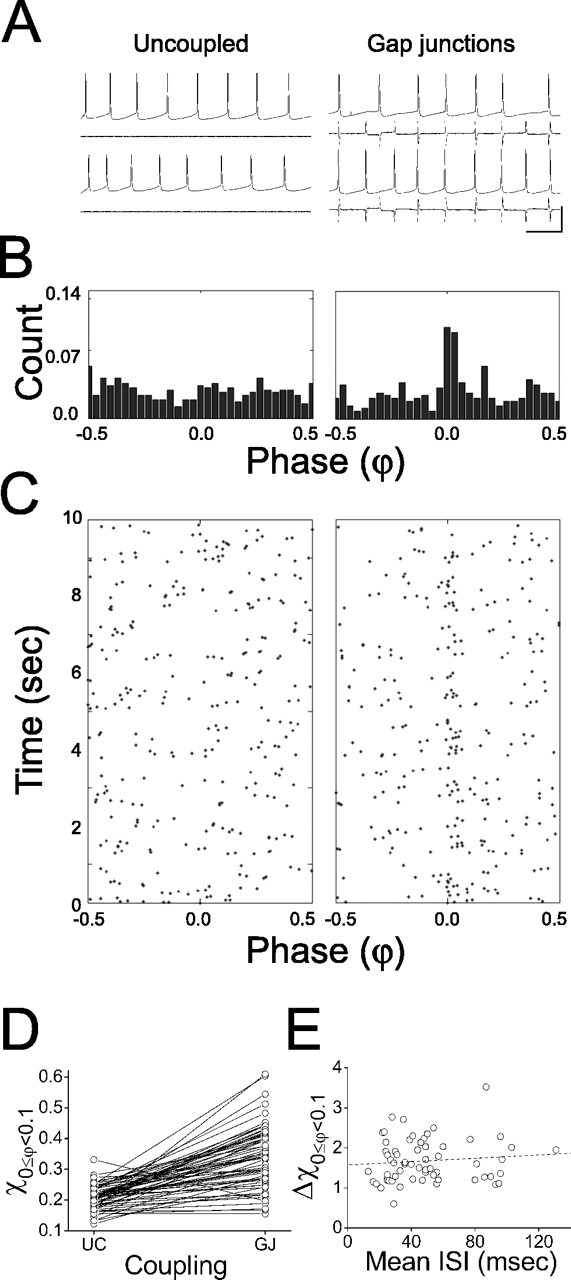
Electrical coupling promotes synchrony in LI networks. A, Sample voltage and current traces from a pair of spiking cells when they are uncoupled (left) and electrically coupled (right). Vertical scale bar: 40 mV, 70 pA; horizontal scale bar, 50 ms. B, Normalized phase (φ) histograms for entire trials in each coupling regimen (columns arranged as in A). C, Raster plot of φ between neighboring spikes for each coupling regimen (columns arranged as in A and B) according to the time in which they occurred during the trial. D, Fraction of spike pairs falling into the synchronous phase range (χ0 ≤ φ < 0.1) for pairs that are uncoupled and electrically coupled (61 trials from 26 cell pairs; trend lines show same-rate, within-pair comparisons). E, Fractional change in synchrony from uncoupled to electrically coupled (Δχ0 ≤ φ < 0.1; samerate, within-pairs comparisons). Note that this change is not rate dependent (n = 61 trials).