
Figure 8.
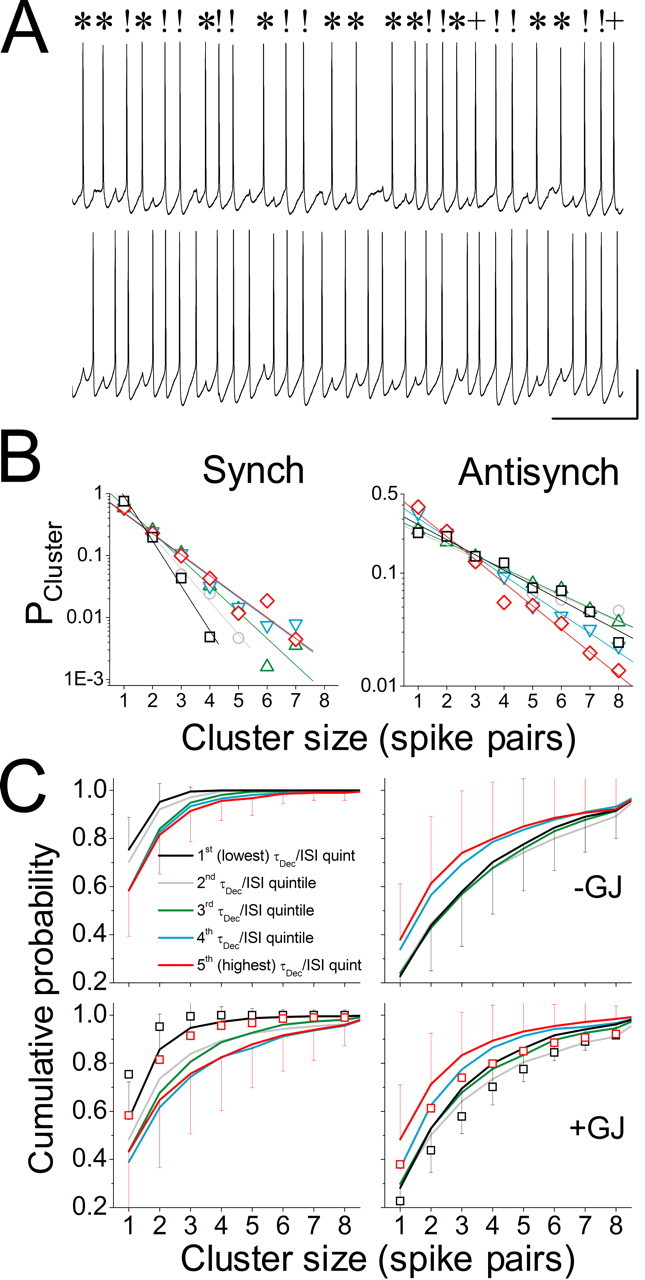
Stability of the synchronous and antisynchronous states has a geometric distribution and depends on both τDecay/ISI and the presence of electrical coupling. A, Sample voltage trace containing clusters of consecutively synchronous and consecutively antisynchronous spike pairs in a bistable LI network. The symbols!, *, and + denote synchronous, antisynchronous, and “intermediate” (neither synchronous nor antisynchronous) spike pairs, respectively. Calibration: 20 mV, 200 ms. B, The probability that spike pairs falling into the synchronous (Synch; left) or antisynchronous (Antisynch; right) phase ranges belong to clusters of n such spike pairs (n = 1,..., 9) for different quintiles of τDecay/ISI [first (lowest) quintile is in black, second quintile is in gray, third quintile is in green, fourth quintile is in cyan, fifth (highest) quintile is in red]. This stability measure was normalized to the total number of clusters occurring in the range for each trial, so that it was independent of the overall frequency with which the range was entered. C, Cumulative distribution functions for the probability that spike pairs belong to clusters of size n, averaged across all trials in each quintile of τDecay/ISI [first (lowest) quintile is in black, second quintile is in gray, third quintile is in green, fourth quintile is in cyan, fifth (highest) quintile is in red]. The top row shows distributions for cell pairs coupled by inhibition alone, and the bottom row shows distributions for cell pairs coupled by combined inhibition and electrical coupling (+GJ). Clusters of synchronous spike pairs are shown on the left, and clusters of antisynchronous spike pairs are shown on the right. For clarity, error bars (SD) are shown only for the first and fifth quintiles. Note shifts toward greater stability of the synchronous state (leftward shift of distributions) and less stability of the antisynchronous state (rightward shift of distributions) as τDecay/ISI increases. For comparison, the data for the first and fifth quintiles for inhibition alone are replotted as black and red open squares, respectively, in the bottom two panels. Note shifts toward greater stability of the synchronous state and less stability of the antisynchronous state for the case of combined coupling versus inhibition alone (compare open squares and solid lines for first and fifth quintiles).