
Figure 2.
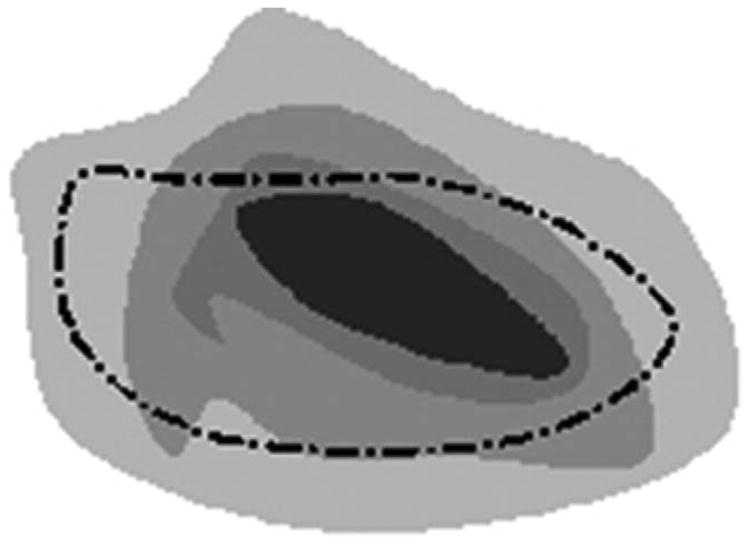
Dashed line shows contour from one radiologist-method combination. Dots depict loci of possible samples from the underlying p-map constructed from the sum of other radiologist-method combinations.
Official websites use .gov
A
.gov website belongs to an official
government organization in the United States.
Secure .gov websites use HTTPS
A lock (
) or https:// means you've safely
connected to the .gov website. Share sensitive
information only on official, secure websites.
Dashed line shows contour from one radiologist-method combination. Dots depict loci of possible samples from the underlying p-map constructed from the sum of other radiologist-method combinations.