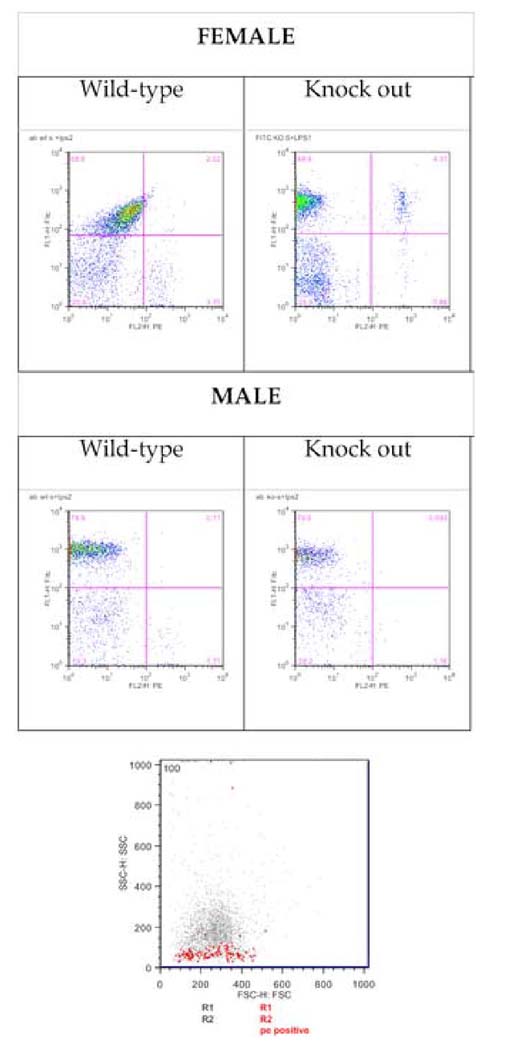
Figure 2. Neutrophil accumulation in air pouch exudates in response to LPS.

Cells were immunostained with a FITC anti-mouse neutrophil and with staining for T helper lymphocytes, phycoerythrin (PE)-CD4. The four panel part of figure shows typical flow cytometry dot plots; the abscissa shows fluorescence intensity for PE-labeled anti-CD4 and the ordinate shows the fluorescence intensity for FITC-labeled anti-neutrophil antibody. An FSC/SSC plot (bottom panel) shows the PE-labeled CD4 cell population; FSC and SSC were adjusted to include only live and nucleated cells (using propidium iodide and Hoeschst (R1 and R2), respectively). The plot shows PE positive (CD4) cells as red dots, with an SSC indicating a lymphocyte population separated from a population of larger and more dense monocytes and granulocytes.
