
FIG 3. 3D Spatiotemporal Separation of Vascular Compartments.
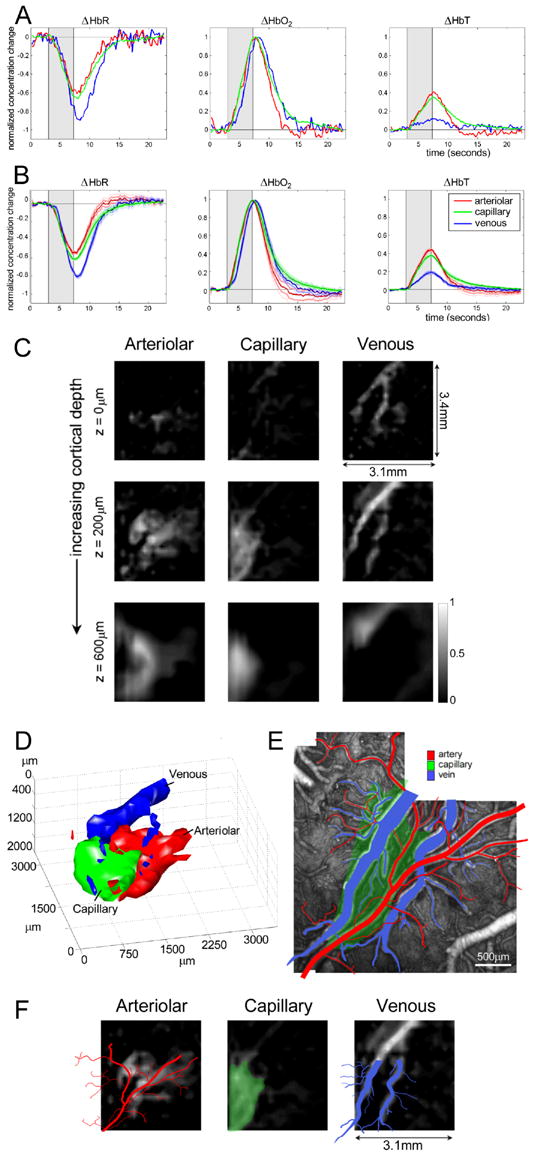
A) The hemodynamic time-courses from voxels labeled a, v and c in Fig 2, representing arteriolar, capillary and venous contributions respectively (normalized to the peak HbO2 value for each compartment). B) Equivalent time courses, averaged over five rats (standard error on the mean error bounds are shown). C) Spatiotemporal components extracted from the 3D LOT data shown in figure 2B. Gray scale represents the amplitude of the component in each voxel that varies according to the arteriolar, capillary and venous functional time-courses shown in A. D) 3D rendering of LOT vascular compartments (40% isosurface) in C. E) Ex-vivo two-photon image stack of fluorescent vascular cast with veins (blue) and arteries / arterioles (red) identified. F) 200 micron depth slice from C overlaid with the tracing of the arteries (red) and veins (blue) from the vascular cast (after linear rotation and scaling). The capillary response from the LOT results is overlaid onto the vascular cast image to indicate the position of the active underlying capillary bed (green).