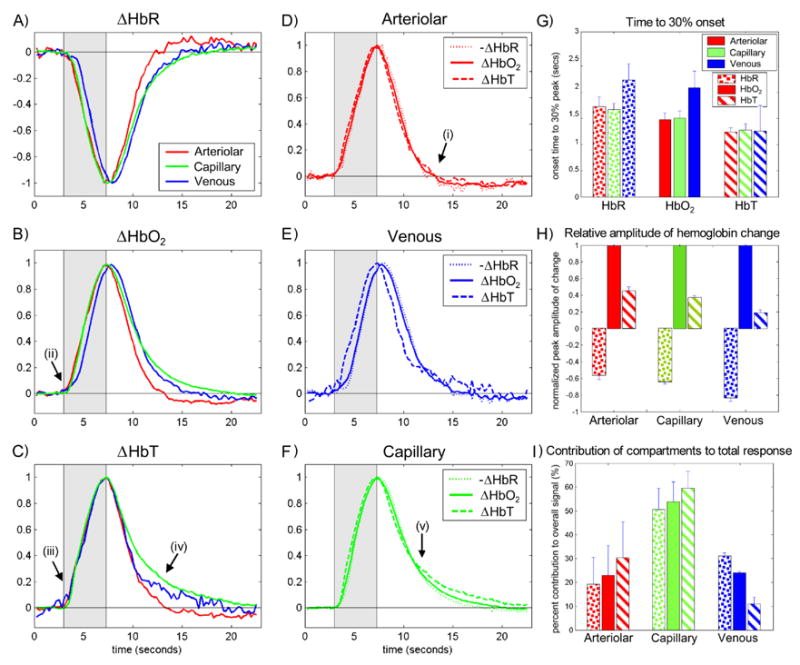
FIG 5. Analysis of Vascular Compartment Time-Course Dynamics.

The timecourses extracted from LOT data for each hemoglobin type (A–C) and vascular compartment (D–F) and are shown normalized to their peak to accentuate onset and decay timing trends. G. Shows time to 30% onset for each hemoglobin type within each compartment. In all cases HbT changes first, followed by HbO2 and then HbR (p<0.03 for all compartments). Note that the same trend is seen in the post-stimulus decay to 70% of the peak (p<0.013). Venous onset is before both arteriolar and capillary for HbO2 and HbR (p<0.02). H. Shows trends in the relative amplitudes of the responses (normalized to the HbO2 response of each compartment). All differences are significant with p<0.016. I. Shows the relative percentage contribution of each vascular compartment to the overall hemodynamic response. This data was calculated with data from 3 rats whose cranial windows were large enough to visualize all major feeding and draining vessels. Note the large overall capillary contribution, the small venous HbT contribution and the large arteriole HbR contribution. Features labeled i – v are described in the text. Error bars on G, H and I show standard deviation.
