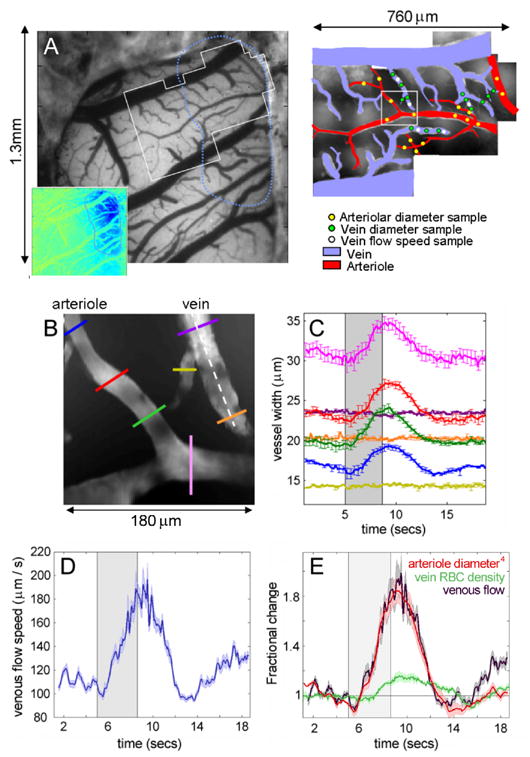
FIG 6. In-vivo two photon microscopy of vascular compartments.

A). The exposed cortex imaged using a CCD camera at 570nm. Inset shows the region responding to 4 second forepaw stimulation. White outline illustrates region examined using in-vivo two-photon microscopy as shown by montage on right. Arterioles and veins are color coded red and blue. Dots illustrate the locations of the quantitative measures given in table 1. B) Shows a representative single field of view from A (180 × 180 microns) containing both an arteriole and a venule. The area was imaged at 14 frames per second for 20 seconds while a 4 second forepaw stimulus was delivered. The vessel diameters at the points indicated by the colored lines on B are shown in C as a function of time (average of 4 stimulus repetitions, error bars show standard error). Note that no significant change in the diameter of the venule is seen. D) Shows the speed of red blood cells in the venule along the white dotted line in B for the same 4 stimulus repetitions (error bounds show the standard error on the mean). Shows the fractional change in the 4th power of the mean arteriolar dilation (proportional to flow by Poiseuille’s law) in B, the fractional change in the red blood cell density in the venule in B, and the fractional change in venous flow, given by the speed change (from D) multiplied by the RBC density change. Error bounds show the standard error on the mean. Note that all parameters (venous flow, speed, arteriolar dilation and RBC density) were evaluated simultaneously over the same 4 stimulus repetitions.
