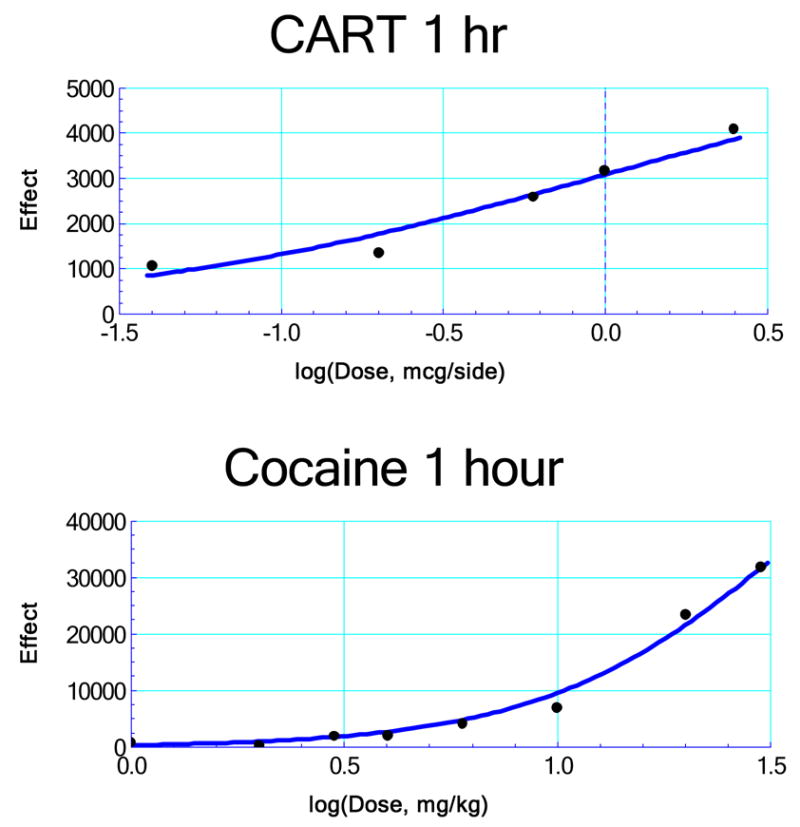
Figure 3.

Dose-effect relations for the individual agents, where the drug effect is the difference between the observed and the saline control value. For cocaine the data yielded an equation given by, , EB = 73030, B50 = 34.55, p = 1.596. For CART the equation is given by, , EC = 6114, AC = 0.924, q = 0.688. The use of these in calculating the additive (predicted) effect of any combination is illustrated by an example in the appendix. See Results section for definition of symbols.
