
Figure 5.
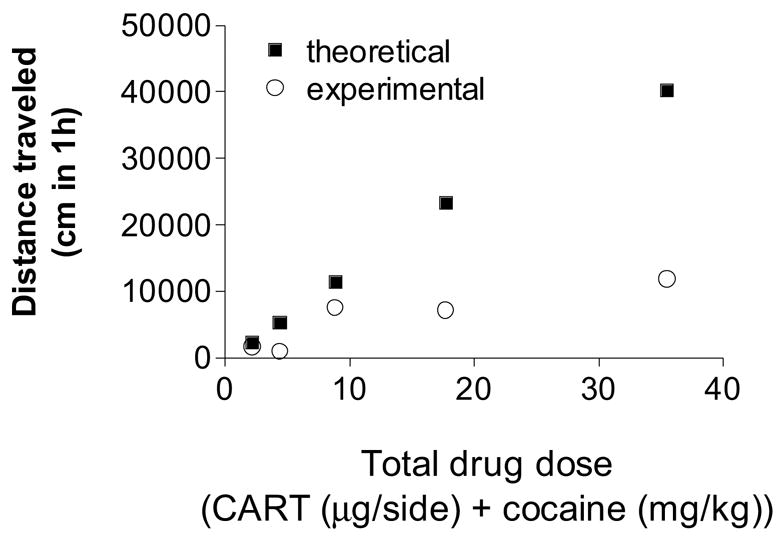
A plot of the theoretical (additive) effect and the observed effect in terms of the locomotive distance traveled after a drug combination whose total is plotted on the horizontal scale. The effect is the locomotive distance over the saline control value. The observed effect is the mean from 8 animals. The two curves (linear regressions) were examined in an overall comparison (ANOVA) of the two regressions (based on the cocaine component) and were found to differ significantly ( P<0.05, F = 73.1).