
Figure 3.
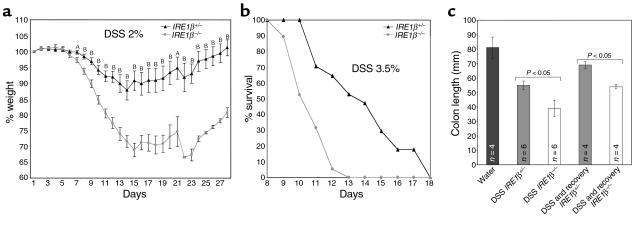
Increased severity of DSS colitis in IRE1β–/– mice. (a) Body weight, expressed as percentage of weight on the day of first exposure to DSS, is plotted against time. Mice were exposed continuously to 2% DSS in the drinking water for days 1–12. Shown are the mean and SEM of a typical experiment carried out on cohort of 23 IRE1β+/– and 23 sibling IRE1β–/– 129svev mice and reproduced three times. AP < 0.05; BP < 0.0005 for the difference in mean value between the two groups (two-tailed t test). (b) Survival of a cohort of 17 age-matched IRE1β+/+ and 19 IRE1β–/– 129svev mice exposed continuously to 3.5% DSS in the drinking water for days 1–12. (c) Comparison of the colon length in untreated mice, and mice of the indicated genotypes treated with 2% DSS for 12 days (DSS) or mice treated with 2% DSS for 12 days and allowed to recover for 15 days (DSS and recovery). Shown are the means and SEM and P values calculated by two-tailed t test.