
Figure 1.
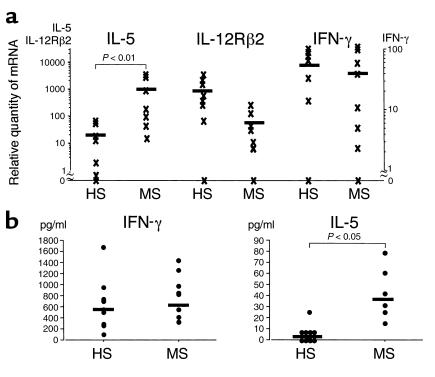
Cytokine production by NK cells in MS and HS. (a) Quantitative RT-PCR for IL-5, IL-12Rβ2, and IFN-γ. Total RNA was isolated from NK cells obtained from patients with MS in remission and healthy subjects (HS). In the Light Cycler quantitative PCR system, the levels of gene expression are expressed by relative values as described in Methods. (b) Quantification of IFN-γ and IL-5 by ELISA. NK cells were isolated from MS in remission or HS and stimulated with PMA/ionomycin in 96-well U-bottom plates (2 × 10⁵/well). The supernatant was collected 24 hours later, and the levels of IFN-γ and IL-5 in the samples were determined by ELISA. Mann-Whitney U test was used for statistical analysis. Horizontal bars indicate the mean values.