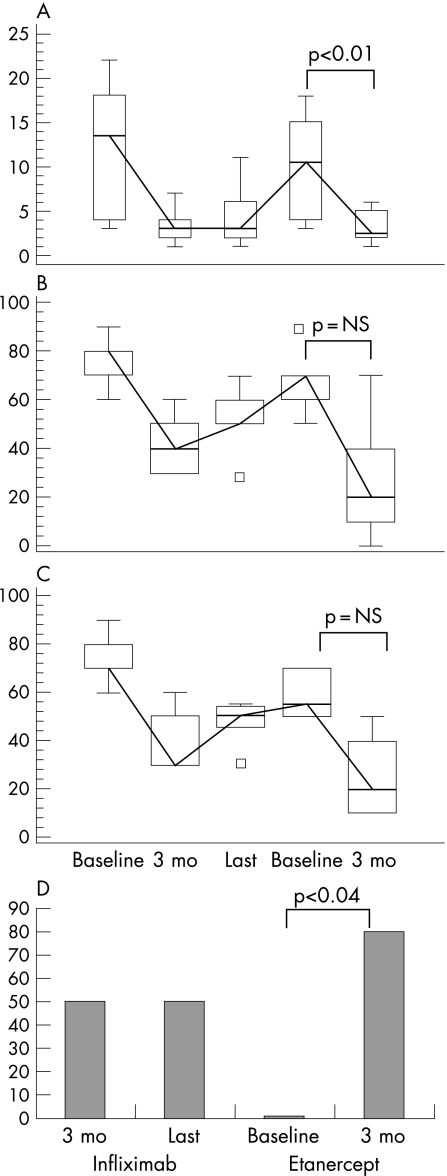
Figure 1 Clinical parameters in patients with AS (n = 6) who switched from infliximab to etanercept. Box and whiskers plot (median, quartiles, range and possible extreme values) of (A) Ritchie Index, (B) patient and (C) physician global assessment (on visual analogue scale); (D) percentage of patients who had 50% improvement on the Bath Ankylosing Spondylitis Disease Activity Index (BASDAI 50). Values shown are the mean values at baseline (before infliximab treatment), after 3 months of infliximab treatment, at last visit while on infliximab, at baseline (before etanercept treatment) and after 3 months of etanercept treatment.

An official website of the United States government
Here's how you know
Official websites use .gov
A
.gov website belongs to an official
government organization in the United States.
Secure .gov websites use HTTPS
A lock (
) or https:// means you've safely
connected to the .gov website. Share sensitive
information only on official, secure websites.
