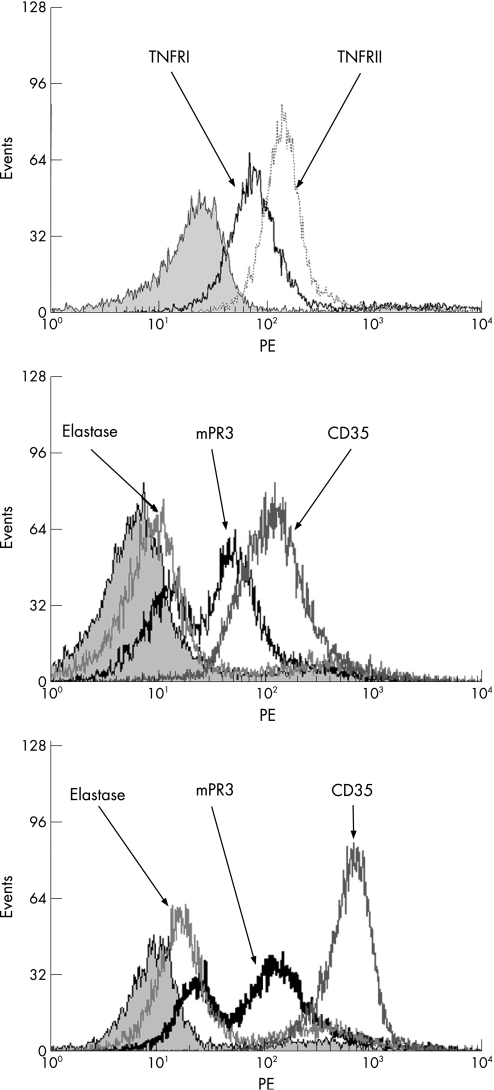
Figure 3 Monomodal expression of TNFRI, TNFRII, elastase and CD35 in bimodal mPR3 individuals. (A) Neutrophils of a bimodal mPR3 individual were isolated and stained for TNFRI (black line) and TNFRII (dashed line). Isotype control is represented by the grey peak. (B, C) Neutrophils of a bimodal mPR3 individual showing monomodal expression of elastase and CD35 before (B) and after (C) priming with TNFα.

An official website of the United States government
Here's how you know
Official websites use .gov
A
.gov website belongs to an official
government organization in the United States.
Secure .gov websites use HTTPS
A lock (
) or https:// means you've safely
connected to the .gov website. Share sensitive
information only on official, secure websites.
