
Figure 1.
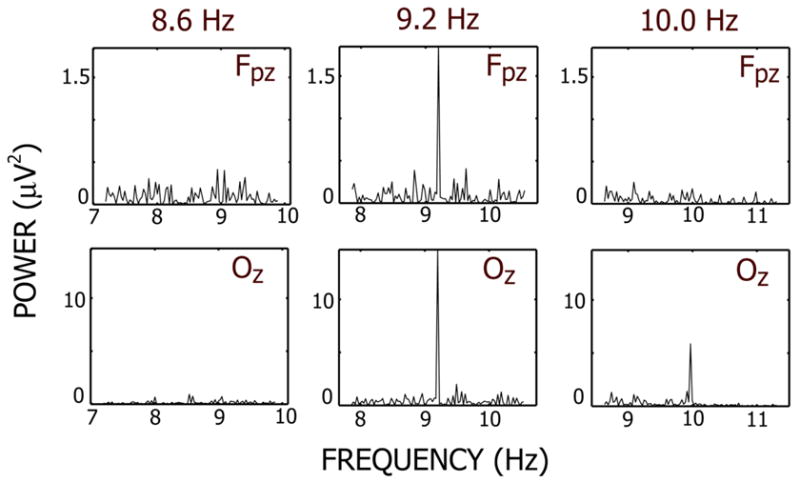
Power spectra at two EEG channels from individual epochs. Each epoch corresponds to a period where the blue stimulus was presented at 8.6 Hz, 9.2 Hz and 10 Hz. The red stimulus was presented at another, higher frequency. Both channels are located along the midline and are labeled by the closest 10/20-system channel location. Power spectra were calculated using conventional FFT methods and are in units of squared μVolts. In each case (A)–(C), the interval submitted to the FFT algorithm was an integer number of cycles of the stimulus frequency. Note that the steady-state response obtained from a single epoch is a narrow-band signal at stimulus frequency.