
Figure 7.
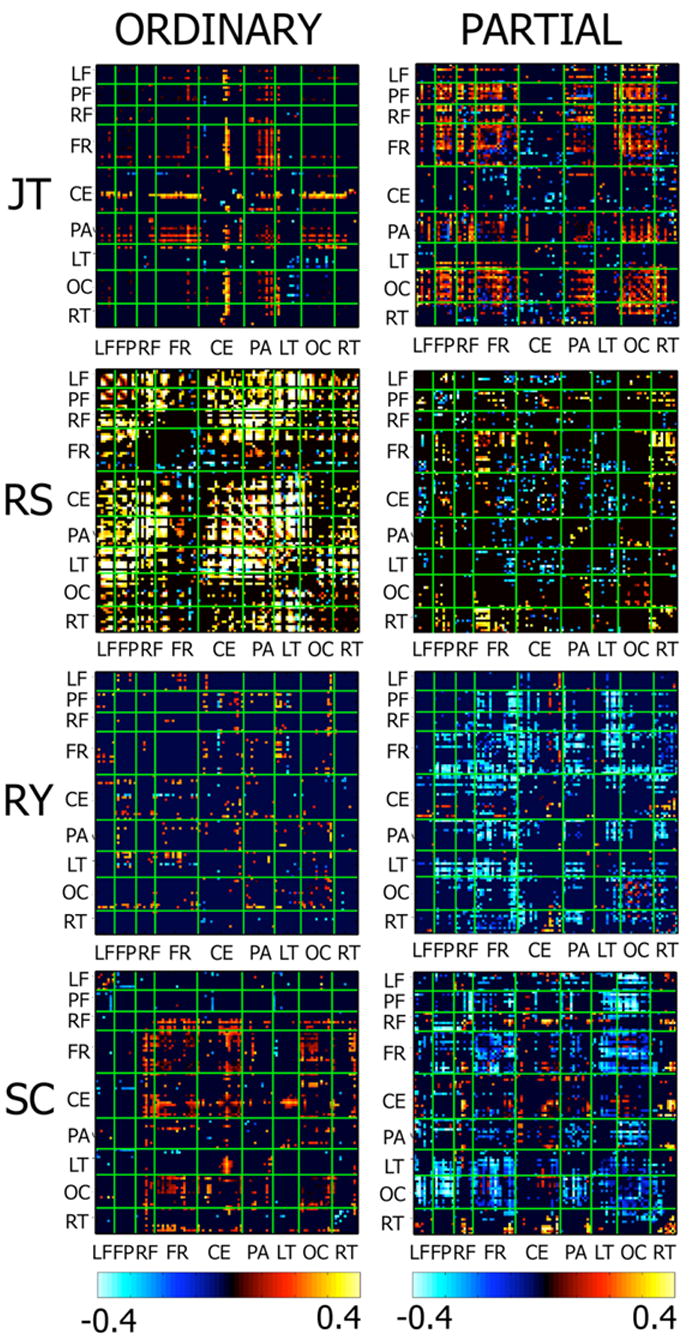
Matrix plots of the difference in ordinary and partial coherence between perceptual dominance and nondominance at the global resonance frequency of 4 subjects. Each matrix has rows and columns organized according to channel groups: LF – Left Prefrontal; FP – Frontal Pole; RF- Right Prefrontal; CF- Central Frontal; CE – Central; PA – Parietal; LT – Left Temporal; OC – Occipital; RT – Right Temporal. The bottom row shows the difference in ordinary and partial coherence between dominance and nondominance. Only significant differences are shown, nonsignificant differences were set to zero.