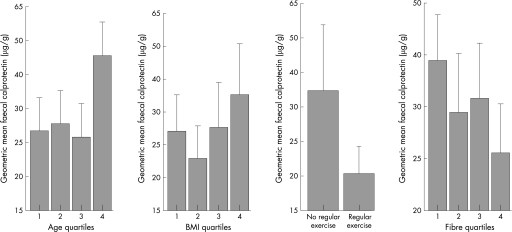
Figure 1 Relationships between age, body mass index, physical activity and fibre intake with faecal calprotectin geometric mean; bars, 1 (SE; y axis logarithmic scale). Age quartiles (years) 1 = 50–54, 2 = 55–59, 3 = 60–64 and 4 = 65–70. Body mass index (BMI) quartiles (kg/m2) 1 = 17.6–23.5, 2 = 23.6–25.6, 3 = 25.7–28.1 and 4 = 28.2–41.2. Fibre quartiles (%) 1<9.8, 2 = 10–13.9, 3 = 14–16.7 and 4 = 17–38.8.5

An official website of the United States government
Here's how you know
Official websites use .gov
A
.gov website belongs to an official
government organization in the United States.
Secure .gov websites use HTTPS
A lock (
) or https:// means you've safely
connected to the .gov website. Share sensitive
information only on official, secure websites.
