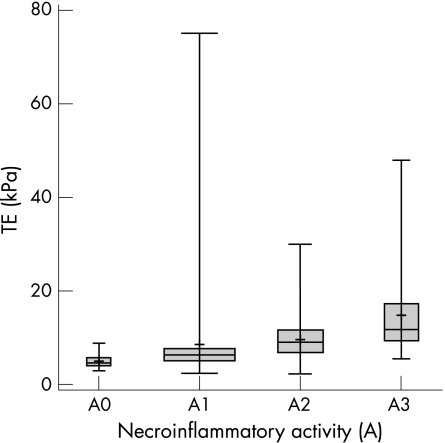
Figure 2 Boxplot reporting transient elastography (TE) results according to the necroinflammatory activity of the 195 patients who underwent both TE and liver biopsy. The mean is indicated by a plus (+) sign. Bars show the minimum and maximum values, median, and quartiles. The box width is proportional to the sample size of the subgroups.

An official website of the United States government
Here's how you know
Official websites use .gov
A
.gov website belongs to an official
government organization in the United States.
Secure .gov websites use HTTPS
A lock (
) or https:// means you've safely
connected to the .gov website. Share sensitive
information only on official, secure websites.
