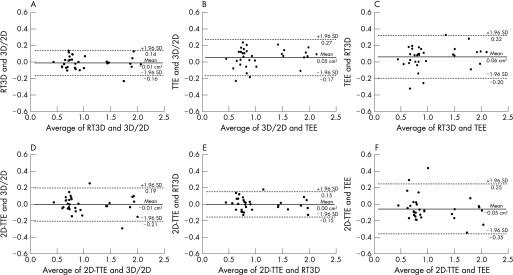
Figure 2 Bland–Altman graphs (A–C) show the limits of agreement and mean absolute differences between planimetric methods: volumetric real‐time three‐dimensional echocardiography (RT3D) and 3D‐guided two‐dimensional imaging (3D/2D) (A), between 3D/2D and planimetry by transoesophageal echocardiography (TEE) (B) and between RT3D and TEE (C). Bland–Altman plots (D–F) show the limits of agreement and mean absolute differences between Doppler‐derived two‐dimensional transthoracic echocardiography (2D‐TTE) and 3D/2D (D); 2D‐TTE and RT3D (E); and 2D‐TTE and TEE (F).

An official website of the United States government
Here's how you know
Official websites use .gov
A
.gov website belongs to an official
government organization in the United States.
Secure .gov websites use HTTPS
A lock (
) or https:// means you've safely
connected to the .gov website. Share sensitive
information only on official, secure websites.
