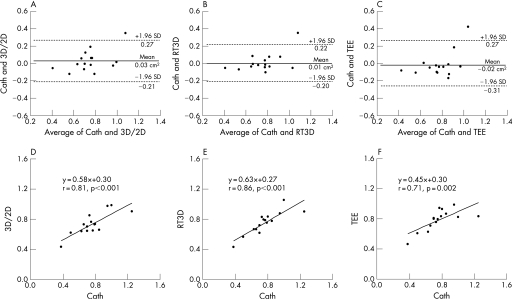
Figure 3 Bland–Altman plots (A–C) show the limits of agreement and mean absolute differences between AVA (aortic valve area) by Cath (cardiac catheterisation) and 2D/3D (3D‐guided two‐dimensional imaging; A), RT3D (volumetric real‐time three‐dimensional echocardiography; B) and TEE (planimetry by transoesophageal echocardiography; C). Linear regression graphs (D, E) show the correlation between Cath and planimetric techniques with regard to AVA estimation: 2D/3D (D), RT3D (F) and TEE (E).

An official website of the United States government
Here's how you know
Official websites use .gov
A
.gov website belongs to an official
government organization in the United States.
Secure .gov websites use HTTPS
A lock (
) or https:// means you've safely
connected to the .gov website. Share sensitive
information only on official, secure websites.
