
Figure 4.
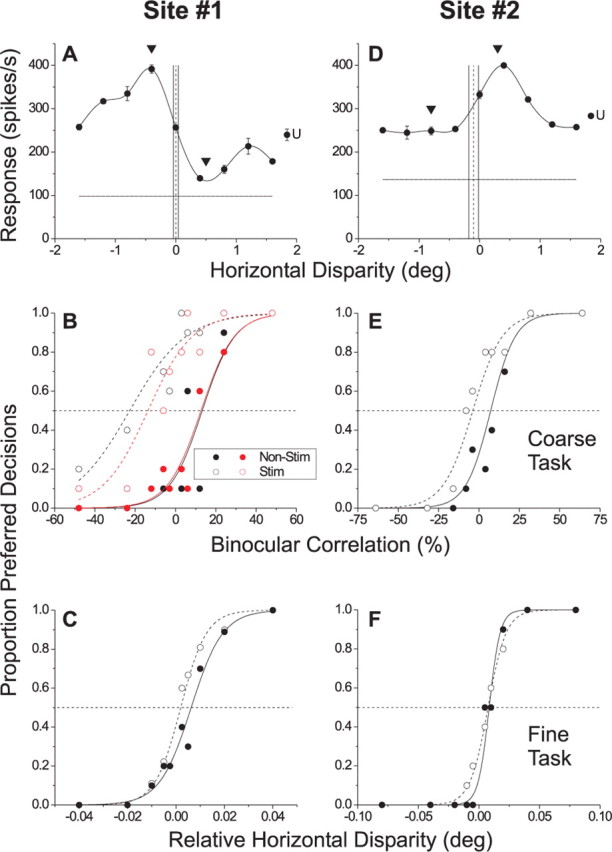
Example effects of MT microstimulation on the two depth-discrimination tasks. Each column shows data for a different stimulation site. A, Disparity-tuning curve of MU activity recorded at a near-tuned site (site 1). Arrowheads denote the preferred (−0.4°) and null (0.5°) disparities used in the coarse task. The dashed vertical line indicates the disparity of the surround patch (0.0°) and the solid vertical lines indicate the range of center disparities used in the fine task. The horizontal line shows the spontaneous activity level. The point labeled “U” denotes the mean response to binocularly uncorrelated dots. B, Effect of microstimulation of site 1 on performance of the coarse task. Filled circles and the solid line represent the psychometric function for nonstimulated trials, whereas open circles and the dashed line show data from stimulated trials. Black symbols show data from the first block of absolute disparity trials. Red symbols show data from a repeat experiment that was performed after an intervening block of relative disparity trials. The horizontal dashed line denotes chance performance. C, Effect of microstimulation of site 1 on performance of the fine task. D, Disparity-tuning curve of multiunit activity recorded at a far-tuned stimulation site (site 2). E, Effect of microstimulation of site 2 on performance of the coarse task. F, Effect of microstimulation of site 2 on performance of the fine task. Error bars indicate SE.