
Figure 5.
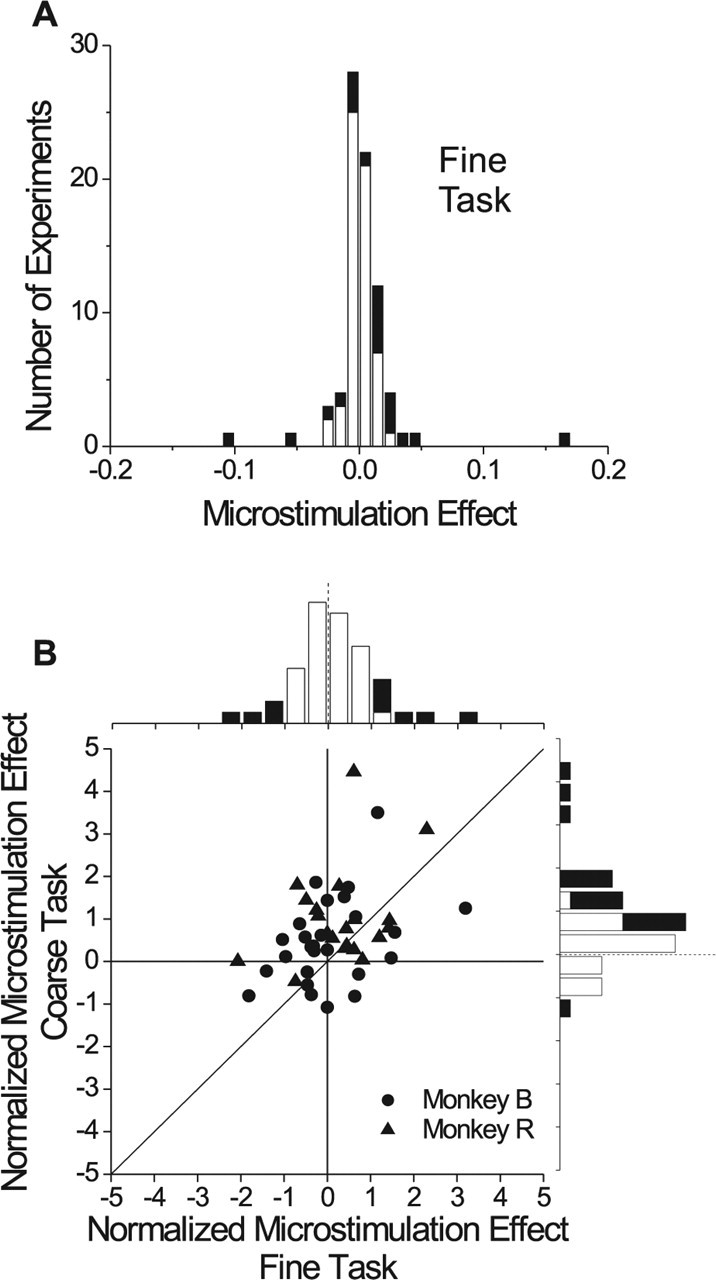
Population summary of microstimulation effects. A, Data are shown for 78 sessions of the fine task. This distribution shows the shift between stimulated and nonstimulated psychometric functions in degrees of visual angle. Black bars denote stimulation effects that were statistically significant (logistic regression, p < 0.05). B, Effects of microstimulation for 46 experiments in which both the coarse and fine tasks were performed in separate blocks. Microstimulation effects are normalized to the slope of the psychometric function (see Materials and Methods) to make the data comparable. Frequency histograms for the two tasks are shown along the top and right margins. Filled bars indicate significant effects (logistic regression, p < 0.05).