
Figure 4.
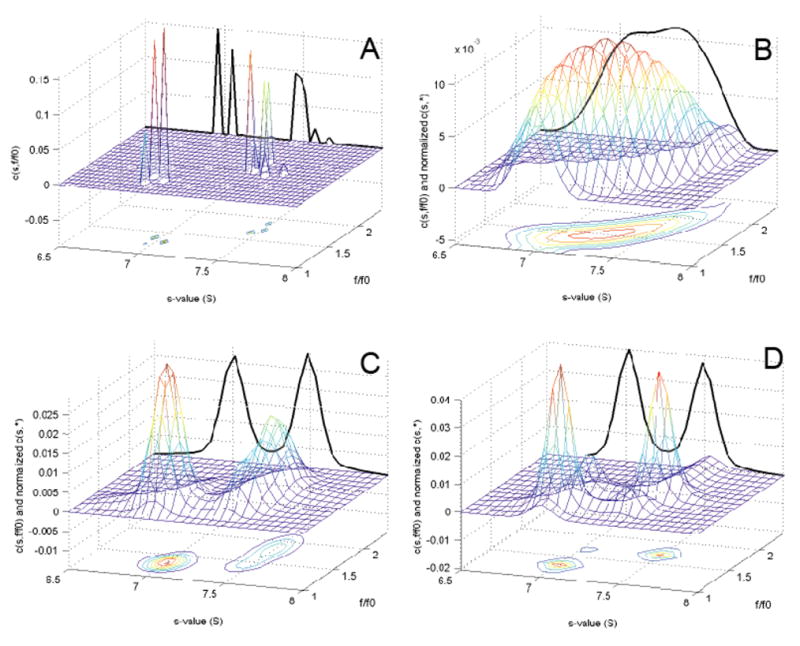
Two-dimensional size-and-shape distribution with prior expectation. Sedimentation profiles were simulated for two species at equal loading concentration with dissimilar frictional ratio: 130 kDa, 7 S, f/f0 = 1.32 and 220 kDa, 7.5 S, f/f0 = 1.74, respectively, sedimenting in a 10 mm column at 45,000 rpm. Normally distributed noise at 0.005-fold the total loading concentration 1 was added. (A) Sedimentation data analyzed with a size-and-shape distribution c(s,f/f0) (Eq. 4) without the use of regularization. Shown are the c(s,f/f0) distribution, together with a contour line representation projected on the s-f/f0-plane. The bold solid line in the far s-c-plane is the normalized general c(s,*) distribution, which is obtained from integration of c(s,f/f0) along the f/f0 axis (Eq. 5). (B) c(s,f/f0) distribution with Tikhonov-Philips regularization at a confidence level of P = 0.7, but without the use of prior knowledge. (C) Size-and-shape distribution c(P)(s,f/f0) using prior knowledge about the s-values of the two species, implemented as Gaussian peaks in the prior expectation at 7.0 and 7.5 S, respectively, with widths of 0.2 S and amplitudes 10-fold above the uniform baseline prior. Tikhonov-Philips regularization was used at a confidence level of P = 0.7. (D) Size-and-shape distribution c(P)(s,f/f0) using prior knowledge about the s-values as in panel (C), and in addition prior knowledge about the existence of two f/f0 values with Gaussian peaks at f/f0 = 1.3 and 1.7, respectively. No knowledge was implemented about which s-value correlates with which f/f0 value.