
Figure 8.
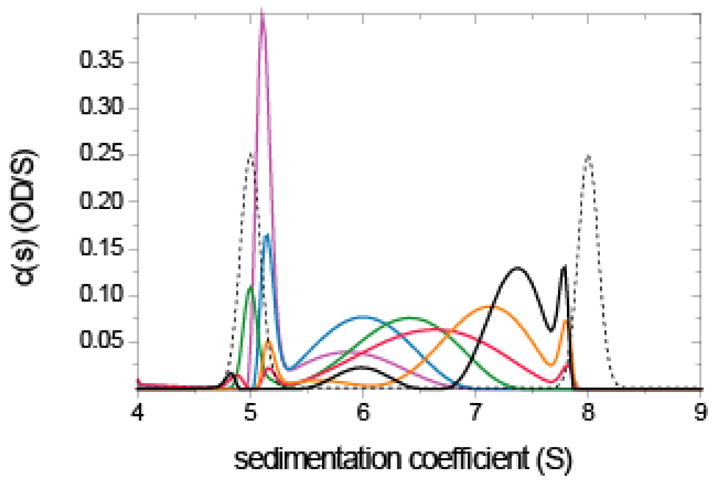
Analysis of a rapidly interacting monomer/dimer system with impostor prior expectation. Sedimentation velocity data were simulated with Lamm equation solutions incorporating reaction terms for a 100 kDa monomer in instantaneous equilibrium with a dimer, with an equilibrium constant of 2 μM, sedimenting at 50,000 rpm. Simulation parameters were chosen to mimic absorption optical detection at different wavelengths, with 0.01 OD noise (see 70). Concentrations were 0.2 μM (magenta), 0.5 μM (blue), 1 μM (green), 2 μM (red), 5 μM (orange), and 10 μM (black). Unless proteins are very elongated, at the highest concentration of 1 mg/ml simulated here repulsive hydrodynamic non-ideality can still be neglected. Shown are the sedimentation coefficient distributions c(P*)(s) (solid lines) using the impostor prior expectation that sedimentation proceeds as if there was stable monomeric and dimeric species (dotted line). Regularization was using the TP method on a confidence level of P = 0.7.