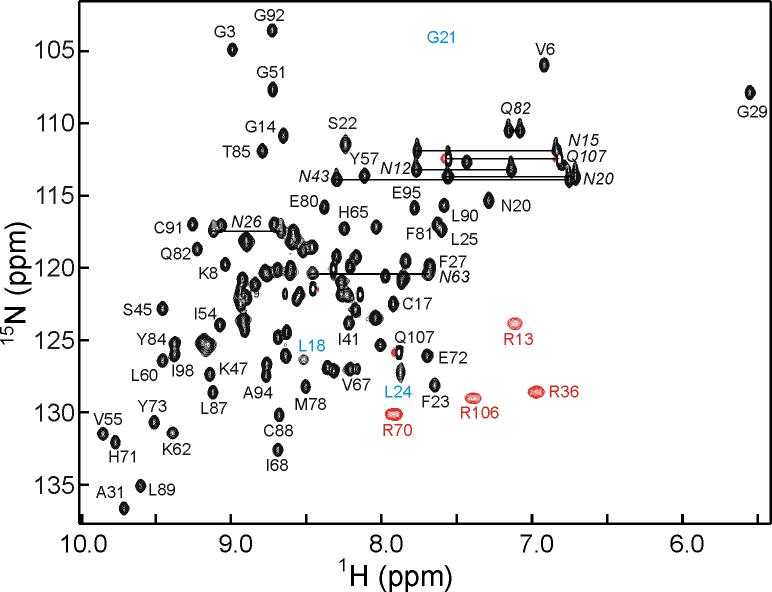
Figure 2.
600 MHz 1H-15N HSQC spectrum of ChCh107 showing selected assignments. The broadened cross peaks for residues 18 and 24 are indicated with blue labels, and the approximate position of the weak broadened cross peak of Gly21 is indicated. Side chain guanidinium cross peaks (folded) are indicated in red, and side chain carboxamide resonances of Asn and Gln are indicated by a horizontal line and italicized label. A fully labeled spectrum is shown in the Supplementary Material (Figure S2).

