
Figure 1. Yeast surface display of BoNT/A domains.
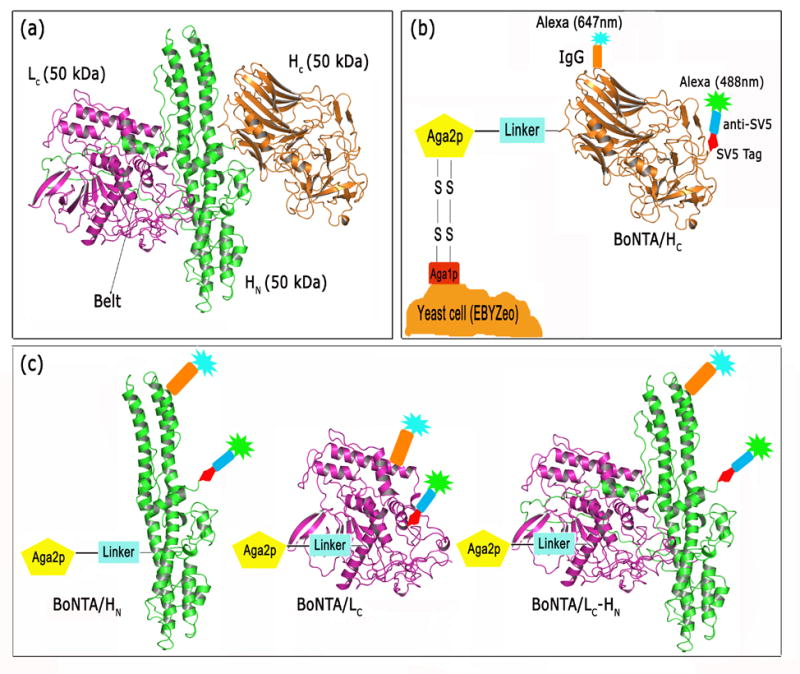
(a) Ribbon cartoon of the X-ray crystal structure of BoNT/A secondary structure (PDB accession name, 3BTA) showing catalytic light chain (LC, magenta), binding (HC, orange) and translocation (HN, green) domains 2. The belt region of HN, which wraps around the LC, is indicated. (b) Schematic representation of yeast displayed HC, fused to the yeast protein Aga2p via a flexible (Gly4Ser)3 linker. The level of yeast display is quantitated via direct or indirect (not shown) fluorescent labeling of an SV5 epitope-tag binding monoclonal antibody. A fluorescent labeled BoNT/A-specific IgG is used to independently verify display. (c) Yeast display of BoNT/A HN, BoNT/A LC, and BoNT/A LC-HN. SV5 epitope tag and domain specific mAbs are shown bound to their respective domains.