
Figure 2. Yeast display of BoNT/A domains and mapping of BoNT/A monoclonal antibodies by flow cytometry.
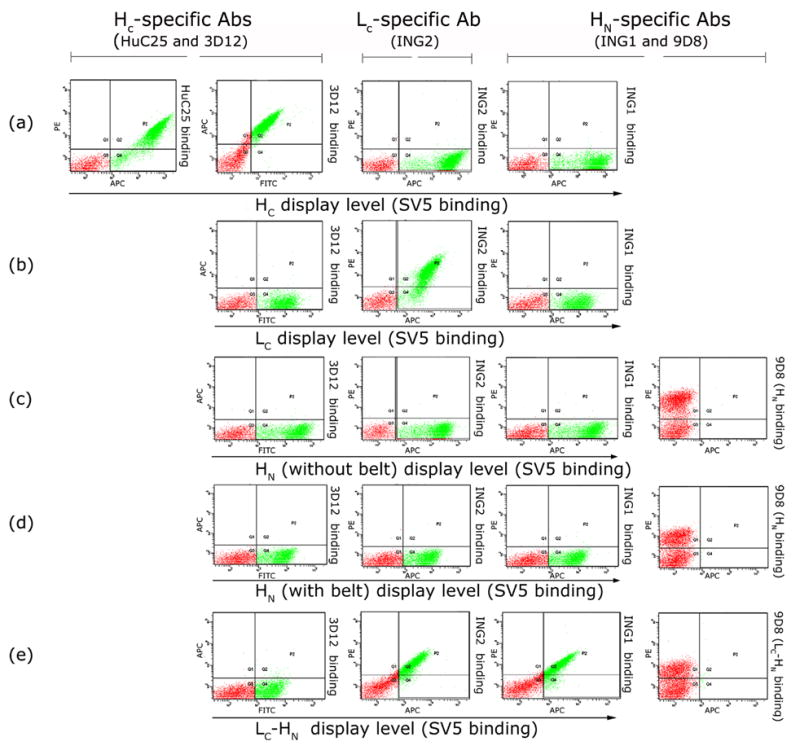
Specific binding to (a) yeast-displayed HC by human mAbs HuC25 and 3D12; (b) yeast-displayed LC by human mAb ING2; (c) and (d) yeast-displayed HN (with (c) or without (d) the belt region) by murine mAb 9D8, and (e) yeast-displayed LC-HN by mAbs ING2, 9D8 and ING1. All domains are well displayed as indicated by a greater than 2 log shift with anti-SV5. All domains are bound only by domain specific mAbs, with no binding of mAbs specific to other domains.