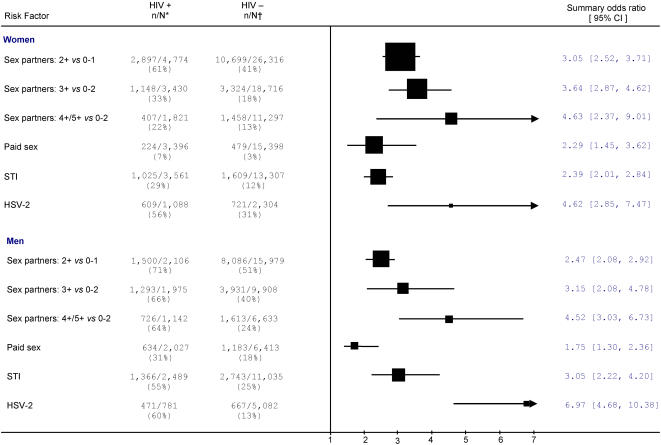
Figure 1. Summary odds ratios of risk factors for HIV among the general population for women and men. Notes:
* n/N represents the number of HIV-positive individuals with exposure to the risk factor over the total number of HIV-positive individuals. † n/N represents the number of HIV-negative individuals with exposure to the risk factor over total number of HIV-negative individuals. The size of the square is proportional to the size of the total population

