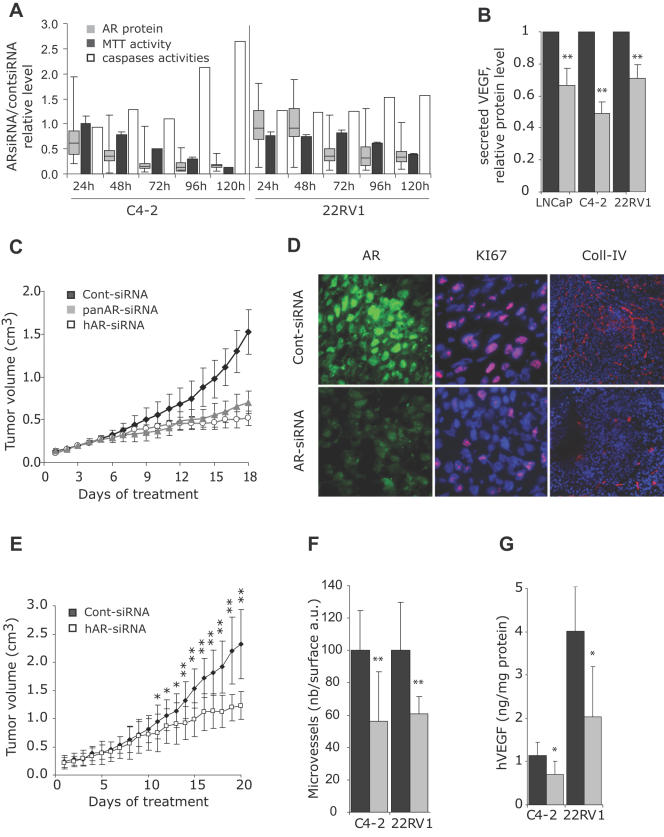
Figure 3. AR-siRNA-induced inhibition of the growth of castration-resistant prostate tumors.
A: C4-2 or 22RV1 cells grown in 10% FCS were transfected with 10nM of cont- or panAR-siRNA using HiPerfect reagent. Grey box plots: at the indicated time points, AR was detected by indirect immunofluorescence, and its expression level was quantified in at least 200 nuclei from at least 5 different high power fields using the simple PCI software in cont- or panAR-siRNA transfected cells. Values at each time point were compared to the mean fluorescence value of the cont-siRNA transfected cell population, set to 1. Each box plot is composed of 5 horizontal lines displaying the 10th, 25th, 50th, 75th and 90th percentiles. In sister wells, the MTT activity (black bars) in AR-siRNA treated cells was measured and expressed as a fraction of that of cont-siRNA transfected cells. The measured caspases activities (white bars) were expressed using the following formula: (caspases/MTT in AR-siRNA treated cells)/(caspases/MTT in cont-siRNA treated cells). B: Relative VEGF protein content in the medium of LNCaP, C4-2 or 22RV1 cells, 72 h after transfection of cells with control (dark grey bars) or hAR-siRNA (light grey bars) (mean±SE, n = 5 to 7 independent experiments). The medium was not changed after transfection. **p<0.01 as compared to values in cont-siRNA transfected cells set to 1. C: Mice bearing C4-2 vascularized and exponentially growing tumors were randomized and received daily i.p. injections of cont-siRNA (Black symbols), hAR-siRNA (white symbols) or panAR-siRNA (grey symbols); tumor volume (cm3, mean±SE n = 6-12). *p<0.05 and **p<0.01 comparing panAR-siRNA to cont-siRNA treated tumors (stars above the curves) or comparing hAR-siRNA to cont-siRNA treated tumors (stars below the curves). D: Frozen sections of regions at the periphery of tumors from C were immunostained by indirect immunofluorescence with AR, KI67 or Collagen-IV antibodies and observed by epifluorescence. Photographs were taken with a 63x (AR, KI67) or 10x (Coll-IV) objective, using the same exposure parameters for cont- and AR-siRNA treated tumors. A representative tumor from each group is shown. E: Male mice bearing exponentially growing 22RV1 tumors were randomized and received either cont- (Black symbols) or hAR-siRNA (white symbols); tumor volume (cm3, mean±SE, n = 5). *p<0.05 and **p<0.01 comparing panAR-siRNA to cont-siRNA treated tumors. F: Mean microvessels density (number of vessels/arbitrary surface unit) in at least 10 non overlapping high-power fields from tumors treated with cont- (black bars) or AR-siRNA (gray bars) in C4-2 or 22RV1 tumors. Necrotic regions were not included in the study. **p<0.01 as compared to cont-siRNA treated group. G: human VEGF quantification in tumor homogenates from C4-2 or 22RV1 tumors in mice treated with cont-siRNA (black bars) or AR-siRNA (gray bars) (ng/mg of protein, mean±SEM). *p<0.05 as compared to cont-siRNA treated group.

