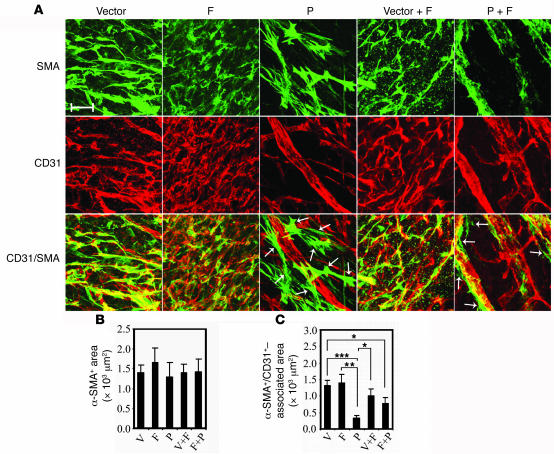
Figure 6. Interaction between VSMCs and ECs in tumors.
At day 14 after implantation, tumor tissues were double-stained with an anti-CD31 antibody and an anti–α-SMA antibody. (A) The CD31- (red) and α-SMA–positive (green) signals were revealed by Alexa Fluor 555– and Alexa Fluor 647–labeled antibodies, respectively, using single-layer projections in a confocal microscope. Overlapping double-positive signals are in yellow color. (B and C) Total numbers of α-SMA–positive vessels were randomly counted from 12 fields/group, and percentages of α-SMA–positive vessels versus total CD31-positive vessels were calculated. The data represent means of average determinants ± SEM. *P < 0.05; **P < 0.01; ***P < 0.001. Scale bar: 50 μm.

