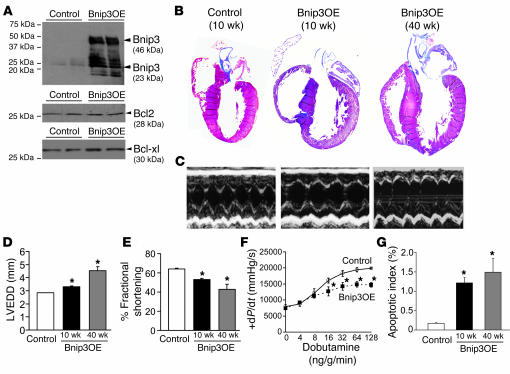
Figure 3. Studies of cardiac Bnip3 overexpression from the neonatal period.
(A) Representative Western blots of myocardial Bnip3, Bcl2, and Bcl-xl in mice with neonatal Bnip3 overexpression (Bnip3OE) and controls. (B) Masson trichrome–stained coronal heart sections. Original magnification, ×2. (C) Short-axis M-mode echocardiograms. (D and E) Echocardiographically determined LV end-diastolic diameter (LVEDD) and fractional shortening as a function of age (n = 7 controls, n = 5 Bnip3 OE at 10 and 40 weeks). (F) Invasively determined LV contractility at baseline and with β-adrenergic stimulation at 10 weeks (n = 3/group). (G) TUNEL-determined apoptotic indices (n = 4/group). *P < 0.05 vs. controls.

