
Fig. 2.
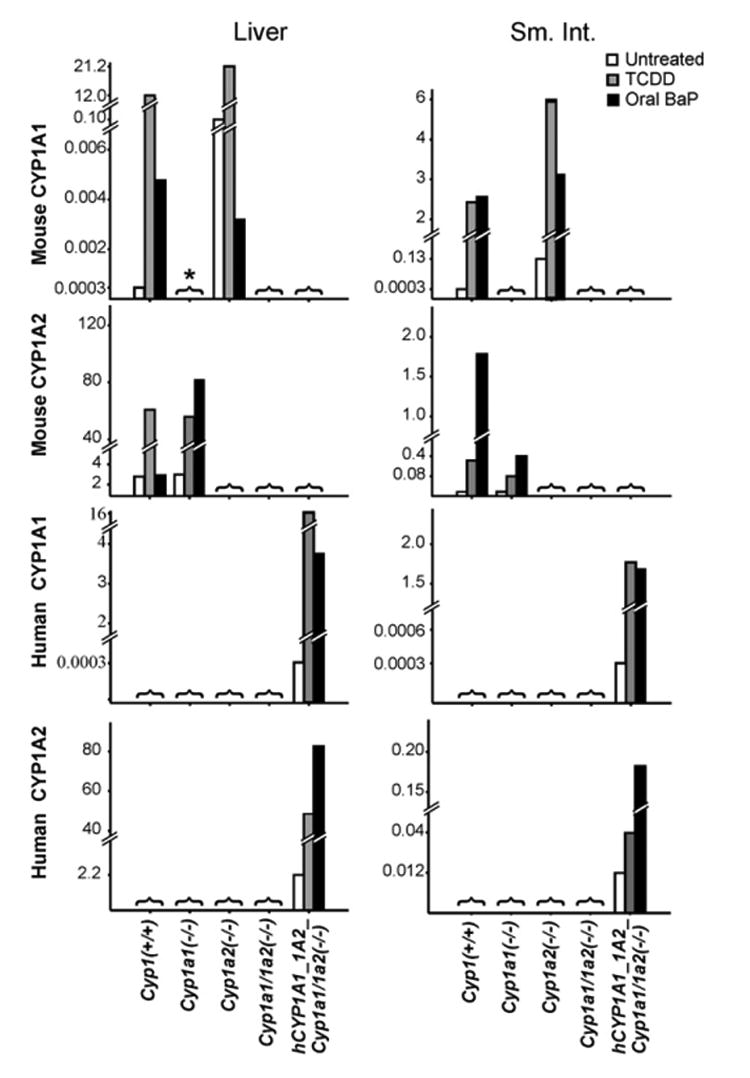
Q-PCR analysis of mouse CYP1A1 and CYP1A2 (top two panels) and human CYP1A1 and CYP1A2 (lower two panels) mRNA in liver (left) and proximal small intestine (right) from the five genotypes under study. Untreated, TCDD-treated, and oral BaP-treated mice are shown. The estimated mRNA levels are expressed as relative amounts after normalization to β-actin mRNA; note these levels on the ordinates vary dramatically––from 0.003 to 80. N = 3 per group. *[with bracket], absolutely not detected at all, which is to be expected due to the global genetic ablation of that particular gene.