
Fig. 1.
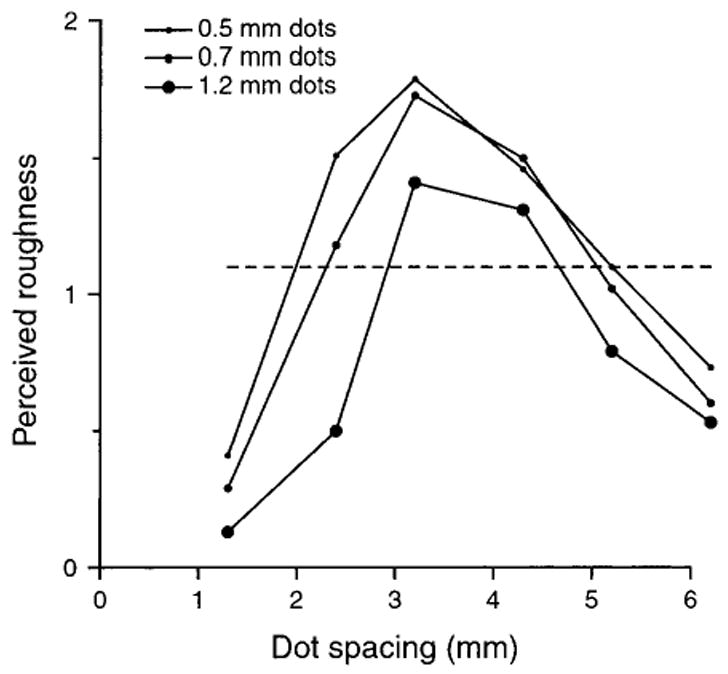
Subjective magnitude responses to raised dot patterns. Subjects scanned their index fingers across patterns of raised dots, 0.35 mm high. Segments of the patterns are illustrated at the top of Figure 2. After each scan, the subject reported his or her sense of subjective magnitude using a ratio scale (Stevens 1946); subjects were instructed to choose whatever range of numbers felt most comfortable, to place no upper bound on the numbers, and to report numbers that were proportional to their subjective sense of roughness. After the experiment, all the reports from a single subject were normalized by dividing each numerical report by his or her overall mean numerical report. That compensated for the fact that subjects chose different numerical ranges. The ordinate represents the mean numerical report (n = 21 subjects) for each of the 18 surfaces used in the study. The abscissa represents the center-to-center distance between dots, which ranged from 1.3 to 6.2 mm. Each of the three curves represents the mean reports for surfaces with different dot diameters (0.5, 0.7, and 1.2 mm). The horizontal dashed line is meant to illustrate the fact that very different surfaces evoke the same report of subjective roughness. The points of intersection between the dashed line and the roughness magnitude curves identify six surfaces that would evoke the same roughness report (1.1 in the normalized scale). If other horizontal lines were included, they would identify other surfaces that evoke the same sense of roughness. The neural coding measure on which roughness perception is based must be the same for each of the surfaces that evoke the same mean report. Adapted from Connor and others (1990).